AEM Logo

PARRE

Program to Assist in Risk and Resilience Examination


User's Guide 2.1

Updated User's Guide for J100-21 Comming Soon

Table of Contents

Introduction


Back to Table of Contents

As a result of the attacks of September 11, 2001, a new focus on securing the Nation's infrastructure brought about development of new risk analysis strategies and programs. In 2009, the water-sector standard, AWWA/ANSI J100-10 Risk and Resilience Management of Water and Wastewater Systems was published. This standard is different than other types of risk analysis due to the fact that it includes a "resilience" component.

This J100 approach to risk and resilience analysis is time consuming and calculation intensive. As a result, Applied Engineering Management Corporation (AEM) took on the task of developing a program to assist you in completing a thorough and complete analysis of your system. By using PARRE, your team will be able to complete the analysis in a timely manner and can be confident that your work will be compliant with America's Water Infrastructure Act of 2018 (AWIA) regulations.

This document is intended to assist you in using PARRE. Step by step instructions will walk you through each step and ensure compliance with the J100. Please note that this document is to be used in conjunction with the J100 standard and is not intended to replace it.

Flow chart
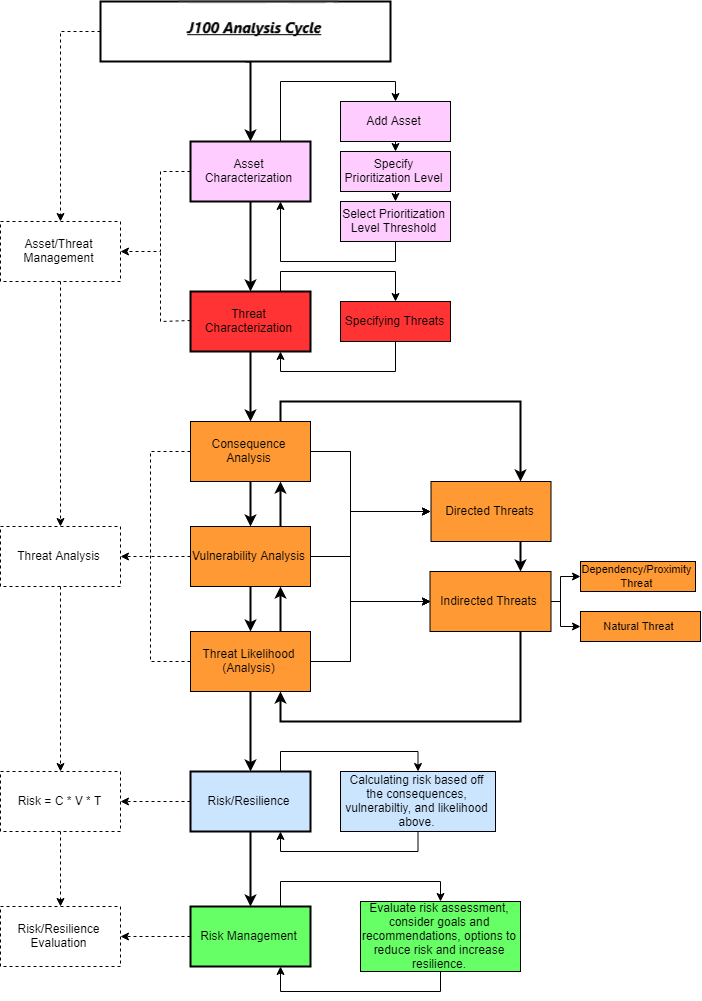
RAMCAP 7-Step Analysis Process


Getting Started

Entering the Program


Back to Table of Contents

Upon arriving at the PARRE website, you will arrive at a screen prompting you to sign in. To get started, click Login in the top left, or Here in the center of the screen.

Login text

A login screen will appear. Enter your email and password and click Log in. If it is your first time using the program, click the Sign Up button to create your account.
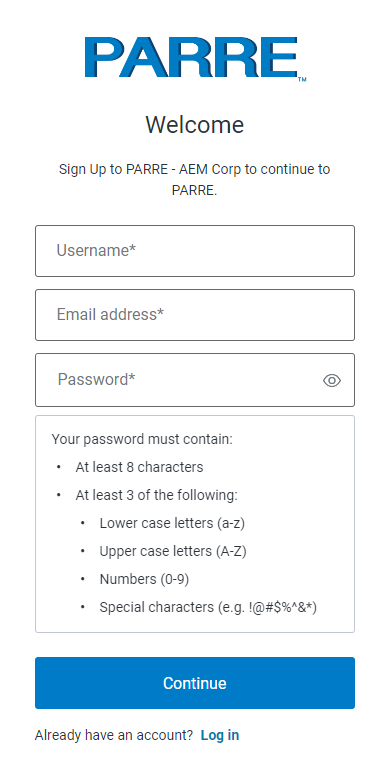
Login screen

After successfully loging on, a welcome page will load, prompting you to open or create a new project. Click this button. The website will direct you to a page showing all your existing projects.


System Navigation


Back to Table of Contents

Review functions and general navigation avalible on any given page of an analysis.

Filtering Data

Each information column can be filtered to sort all data by that specific column. Filter by clicking the white filter icon Filter button above the desired data column heading.

To add/change a filter, use the scroll tabs to find the desired filter. Each filter will display "items with value" that are in the scope of a specified filter.

To save the filter, press the orange filter box.

Filter image

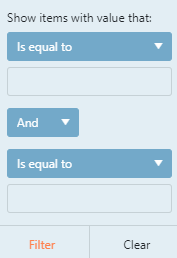
To cancel a filter, press clear. No information will be sorted.


Grouping Information Headers

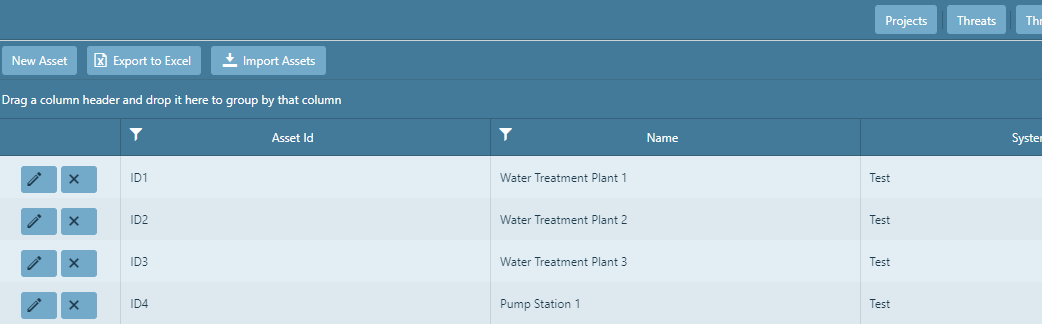
Any data column can be sorted by heading (e.g. Projects can be sorted by any column of category such as Name, Description, Address, etc). To group a column by category, click and hold the desired category box. As you click and hold, an orange box will appear with a symbol

Project name with no symbol
to the left of the name. Drag it over the Drag a column text and release. The symbol left of the name will change to
Project name with plus symbol
when the hold can be 
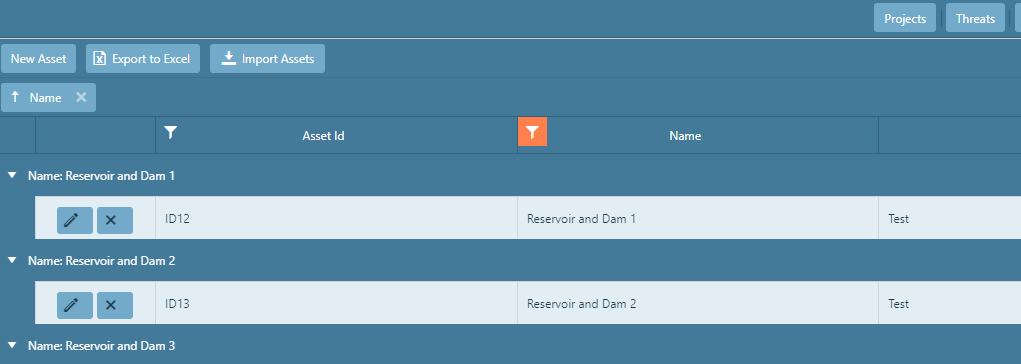
released over the text. A new box with the sorted column name will appear above the category boxes. The figure below is an example of sorting the projects page:

Before dragging column header After dragging column header

Before dragging column header

After dragging column header

To undo a grouping, press the data box with the symbol (x) below New Project. This will return the page to its initial conditions.


Refreshing the Page

Click the refresh button in the bottom right corner to refresh the page at any time.

Refresh button


Viewing All Line Items

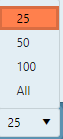
To control how many line items are viewed on one page, click the box (bottom left) next to the left of items per page to view/specify other options.

View all


The "Help!" Button

By clicking the Help link button on the bottom of each page, you will be directed to this User's Guide with instructions on how to complete each part of the analysis.

Opening and Editing an Existing Analysis


Back to Table of Contents

To open an existing analysis that you have already created, click Open Project on the existing project you want to open.

Select analysis

This page also allows you to perform many tasks related to your projects. You may switch between analyses, edit basic information about an analysis, share and remove read/write access to your projects with other users, create a new analysis, and delete an analysis.

To create a new analysis, click New Project. See section Creating a New Project below for steps to creating a new analysis.

To edit the general information of an existing analysis, click the Edit button edit button next to the desired analysis name from the list.

To delete an existing analysis, select the desired analysis name from the list, and then click X.
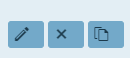

Creating a New Project


Back to Table of Contents

Once you have logged in, you will be directed to the main projects page where you will be able to:

To create a new analysis project, click the New Project New probject box box found at the top left of the page.

Main projects page

General Information

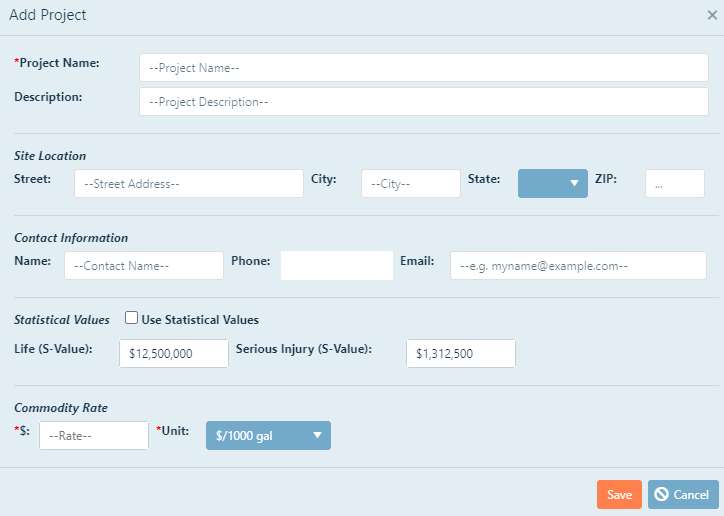
Once you have added a new project, a pop-up screen will appear. You will be directed to input the information displayed in the following figure. Please be aware that clicking the Save box will save and close the project window. It is suggested that all the information is inputed in the boxes before saving, that way re-opening the window is not needed.

Note: Project Name, Commodity Rate and Units are required inputs. The screen WILL NOT save without them.

Add project popup

Project Name: In order to begin your analysis, you must give it a name. This is helpful for a few reasons:

  1. If you make a major mistake; you can create a new file and start over.
  2. If you would like to create multiple analyses and have the ability to compare results; you can switch between them at any time.
  3. If you are planning on performing a PARRE analysis on multiple facilities and would like to store them in their own files.

Choose a name that you are comfortable with. It may be the name of the facility or asset to be analyzed, the date, or version number for example. Click inside the text box, and then type the desired name

Description: This is a more detailed description of the analysis. It is used to distinguish between analyses that have similar names. You may add anything you would like to the description.

Click inside the text box, and then type the desired description.


Site Location

The site location can be described multiple ways. It could be the location of the main facility for the system being analyzed. It can also be the centroid of the system or area being served.

Add or edit the contact name, phone number and email address by clicking in the desired text box. When finished, continue to the next box or click Save to close the window.


Contact Information

The contact person for the analysis should be the person that leads the effort and will have the most knowledge regarding the assessment if questions arise in the future.

Add or edit the name and address of the location being assessed by clicking in the desired text box. When finished, continue to the next box or click Save to close the window.


Using Statistical Values

You will decide at this point whether you will be using the statistical values of life and serious injury in your analysis. These numbers give a monetary value to a lost life and a serious injury.

If you choose not to use the statistical values of life and serious injury, leave the Statistical Values box unchecked.

If you chose to include statistical values of life, you have two choices; You may use the predetermined values given in the program, which are the 2016 Department of Transportation (DOT) values, or you may provide your own values.

To include the statistical values of life and serious injury in your analysis, click the life s-value box.

To use your own values for Life (S-Value) and Serious Injury (S-Value), click inside the desired text box and type your desired value in millions of dollars.


Commodity Rate

Commodity Rate is the price water is being sold to your customers.

Add or edit the Commodity Rate and Units by clicking in the desired text box. When finished, continue to another information box or click Save to close the window.


When all of the desired information above is entered, click Save.

To save the information, click Save. This action will save the entered data and close the window, returning to the main projects page.

To cancel the Project, click Cancel. This action will close the window and return to the main projects page.


Importing Legacy PARRE Project(s)


Back to Table of Contents

To import a backed up project from a legacy PARRE desktop application, in the Projects page click on the Import Project button next to the 'Project Access' button. This action with opend the Import PARRE Project pop-up window.

Import PARRE Project

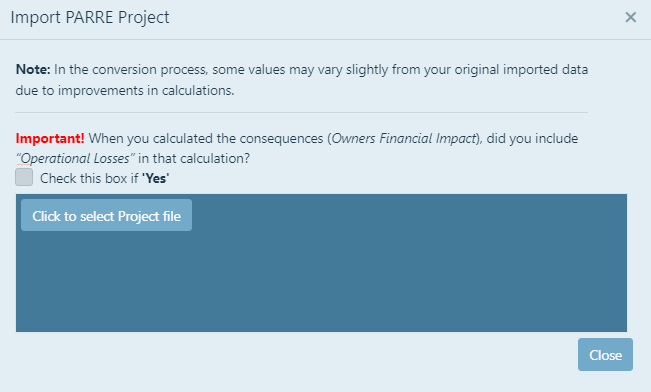
Note: In the conversion process, the "Natural hazards" consequences values may vary slightly from your original imported data.

If applicable, select the checkbox to answer the Important question regarding 'Owners Financial Impact' and 'Operational Losses', then click on the Click to select Project file button. This action will allow you to select a PARRE backup file in a '.json' format. Once you have made a selection click on the Open buttonn to add the file to the 'Import PARRE Project' window. Click on the Click to Import button to start the import process.

Click to Import Button

Note: Only PARRE backup files in .Json format are used to restore legacy project data.

Once the Click to Import button is clicked, you will be presented with a pop-up message window. This window displays a message stating that the restoration of the legacy project will be performed in the background.

Background Import Message

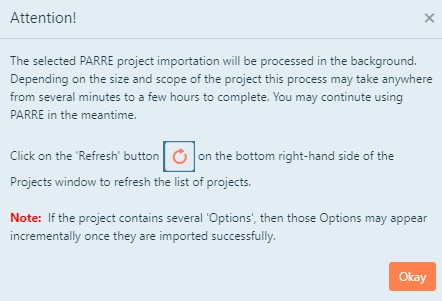
If the selected legacy project has been successfully queued as a background process a Queued Successfully pop-up message will appear. Otherwise, an error message will be displayed.

Background Job Queued Successfully


Adding and Removing User Access to Projects


Back to Table of Contents

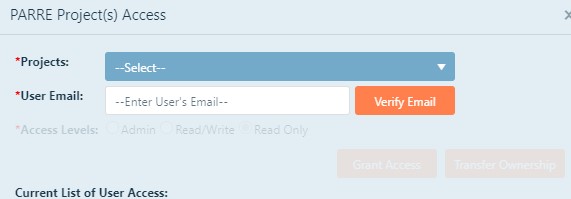
To add or remove user access from your projects, go to the Projects page and click Project Access next to the New Project button. Select the project you want to give access to, and add the users email. Click Verify Email to confirm the user is in the system. Then, select the level of access you want to give, and then click Grant Access. Click the Close button to close this screen.

Project access window

Asset Characterization


Back to Table of Contents

This is the first step in the RAMCAP process and it is important to include all necessary information to accurately move forward in your analysis. This page is used to define all of your assets, decide which ones are critical to the operation of your system, and give prioritization levels for each.

Asset characterization page

To go back to the main projects page, click Manage Projects.

To go to the Threat Characterization page without going back to the home screen, click Manage Threats.

To go to the threat-asset matrix, click Threat-Asset Matrix.


Adding/Deleting Assets

To add an asset to your system, click the New Asset New asset button box in the upper left. A pop-up window will appear, and you will be directed to input the requested information partaining to your asset, as displayed in the following figure. All required data boxes are marked with a red astrik— the asset won't save if they are not filled in.

Adding an Asset

Add asset button

Asset ID: This can be an ID that you chose for this analysis, or can be an ID number that is contained in your asset management system. To enter an ID, click in the text box, and then type the ID.

Asset Name: The name should be distinguishable from other assets in the assessment. Example: 20th Street Pump Station. To enter a name, click in the text box, and then type the name.

Description: You can add additional information about the asset here, but is not required. To add additional descriptions, click in the text box, and then type the description.

Year Built: This is the year the asset was built. If there has been a major rehab or rebuild since that time, enter the year of the major rehab or rebuild. This is intended to identify the building code associated with the asset when a threat, specifically a natural threat, occurs. To enter a year, click in the text box, and then enter the four-digit year.

System type: System type allows you to group the assets. General groupings may be tanks, pumps, distribution, treatment processes, etc. You must add your own system types; however, once you add one, it will be saved as an option for future assets and you will see it listed as availible to use. To add a system type, click in the text box, and enter the type. To select an already used type, click the pull-down next to the box, and choose an existing type. If you try and select a system type before adding one, you will get the following screen:

Syster type error

Simply type in the Enter New box and click "Yes, add new System Type".

Zip Code: Enter the zip code for the asset. To enter the zip code, click in the box, and then type the five-digit zip code.

Latitude/Longitude: Entering a valid zip code will allow for the program to find the centroid latitude and longitude of that zip code. Once the zip code is entered, click the Get GIS Coordinates Get GIS Coordinates box, and the latitude/longitude cells will populate with the specific coordinates for that zip code. You may also enter in the exact GIS Coordinates of the asset.

Replacement Cost: The replacement cost for the asset is the dollar amount that would have to be invested, in today's dollars, to fully replace the asset. To enter the replacement cost, click in the text box, and then enter the cost in dollars. You do not need to add the dollar $ symbol, it will add it once you are done typing in the box.

Asset Type: The asset type helps to identify the ability of an asset to withstand an attack, namely natural hazards. It helps to differentiate between potential damage to a weaker asset, like a trailer, and a stronger asset, like a pump. To select an asset type, click on the drop-down menu, and then chose the asset type.

The final step in adding an asset is prescribing prioritization values to each of the asset's impact on human, financial, and economical categories. To review an explanation of prioritization values, see Adding Prioritization Levels

.

Adding Prioritization Levels

Each asset must have prioritization levels assigned to it. However, you are able to decide which ones are critical enough to be included in the analysis (see Selecting a Prioritization Level Threshold).

There are 3 categories of prioritization, which are described below:

You can give each asset a score from 1 to 5 on each of these factors:

Prioritization levels

  1. Very Low Priority
  2. Low Priority
  3. Moderate Priority
  4. High Priority
  5. Very High Priority

In the Add Asset or Edit Asset pop-up window, choose the appropriate value from each pull down that describes the priority level you have decided upon.

Click Save once all choices have been made or click Cancel to discard the asset.

Notes: Add any notes to your asset for your own reference.

Clicking the Save box will save and close the Add Asset window. Once all information is entered, click Save.
Clicking the Cancel box will close the window without saving the new asset. If you want to discard the information you have entered, click Cancel.

Selecting a Prioritization Level Threshold

Once you have added all of your assets and assigned prioritization levels, you must decide which assets you will move forward with. The last column on the assets page is the prioritization level Total. This total is the sum of the human, financial, and economic prioritization levels and will range from 3 to 15.

The Prioritization Level Threshold Prioritization level threshold(upper right of page) is the minimum prioritization level total that will be assessed against threats. Click the drop-down box, then chose the number that you see fit to be the minimum total. Any asset with a total PL below this number will not be used further in the program, and will not be visible on the assets page. This action does not delete your asset. To view all assets regardless of prioritization level total, click All in the Prioritization Level Threshold scroll-down.


To delete an asset that you have added, click on delete icon Close X image to the left of the asset row.

To edit an asset that has already been saved, click edit icon Edit icon to the left of the asset row.


Threat Characterization


Back to Table of Contents

The threats that exist against every asset in your system are predefined by the J100 standard.
This section is the second step in the J100 process which helps you to identify which threats are applicable to your system to be further assessed.


Threat characterization

Adding/Deleting Threats

The J100 standard requires that all threats are accounted for unless there is sufficient justification that a threat will not occur. All of the threats are checked by default. You should not uncheck any of the boxes without including proper justification, e.g. a facility located in the State of Utah would not be affected by a hurricane of any type. Each scenario is predetermined and cannot be altered.

The process for adding threats is the same as the process for assets. However, you will only need to add a threat if you determine an unprescribed threat that is important. Before you add a threat, review the predetermined threats to ensure you are not adding one already present (see Threat Description).

Adding a Threat

It is optional to add threats outside the ones predetermined by the J100 standard. If there are other threats that you have determined are important, you may add them to the analysis.

To add a threat to your system, click the New Threat box in the upper left. A pop-up window will appear, and you will be directed to input the requested information pertaining to your asset, as displayed in the following figure. All required data boxes are marked with a red asterik — the asset won't save if they are not filled in.

Add threat window

Hazzard Code: This is a Hazard Code that you chose for the new threat. To enter a Hazard Code, click in the text box, and then type the Code.

Name: This is a unique name that characterizes the threat (e.g. Hurricane, Tornado, Hail, etc.).

Hazard Type: Enter the type of hazard. Be sure to follow the same formatting as the other existing threats (e.g. Natural).

Threat Category: Select a threat category from the drop-down menu. If you choose Man-made Hazard from this drop-down, you will have to enter a detection likelihood. The detection likelihood is the probability that authorities will be notified of the potential attack before the attacker has a chance to carry it out. Each of the existing man-made threats have pre-determined likelihoods outlined in the AWWA J100-10 Standard in Table F-2 on page 67, which are pre-programmed into PARRE. The value must be between 0.0 and 1.0. To enter the likelihood, click in the text box, and then enter the value.

Clicking the Save box will save and close the Add Threat window.
Clicking the Cancel box will close the window without saving the new threat.

Deselecting Threats

The J100 standard requires that all threats are accounted for unless there is sufficient justification that a threat will not occur. All of the threats are checked by default. You should not uncheck any of the boxes without including proper justification, e.g. a facility located in the State of Utah would not be affected by a hurricane of any type. Each scenario is predetermined and cannot be altered.

To deselect a threat, click on the check-box under the Threat Active column on the main threats page, in the same row as the given threat. An Add Note box will appear for you to provide justification for not analyzing that particular threat. You must give justification in order to remain J100 compliant.

Add note window

Click Save to save your reasoning. Your justification will appear below the unchecked box and that threat will not appear in the remainder of the analysis.

To select a threat that was previously deselected, click the check-box under Threat Active. The threat will reactivate and the justification text will no longer be shown.

Editing/Deleting Threats

When a new threat is created, two boxes will appear to the left of the new threat. To edit a threat that you added, click the edit threat icon Edit icon. The Edit Threat window will appear for you to edit your threat. Click the orange Update box to save your edits, or click cancel to discard updates. You may not edit any of the predetermined threats.

To delete a threat that you added, select the threat that you want to delete, and then click the delete threat icon Close X button. The threat and all of the accompanying information will no longer appear.


Threat Description

This section shows all of the threats that can be analyzed. These include natural hazards, dependency and proximity hazards, and malevolent or man-made threats. The scenarios are explained here to assist you in making a decision regarding their inclusion in the analysis.

Natural - N

Natural Hazards fall into four categories in this analysis: hurricanes, earthquakes, tornadoes, and floods. As defined in the J100 standard, they are:


Dependency and Proximity - D

Dependency and Proximity hazards are threats that occur outside the facility that could affect the facility and its operation. These threats include attacks on supplies, employees, and customers that are important to keep the facility running. It also includes attacks on a nearby facility that can damage the facility being analyzed. As defined in the J100 standard they are:


Product Contamination - C

The intent of product contamination is to cause harm by introducing an undesired contaminant to the system that would cause harm to customers or to the system.


Sabotage - S

In all of these threats, the intent is to cause harm by damaging, disabling, or destroying process control systems. The four ways an attack of this type can be accomplished are:


Theft or Diversion - T

In all of these threats, the intent is to steal or divert information, dangerous substances, valuable resources, etc. The four ways an attack of this type can be accomplished are:


Attack: Marine - M

An attack by a maritime vessel is only possible of your facility or critical assets to your facility are located in/directly next to a body of water. This type of attack assumes that the boat is carrying explosives and the boat itself strikes your asset. There are four different categories of a marine attack.


Attack: Aircraft - A

An attack by an aircraft assumes that the aircraft would be used as the weapon and would strike your asset directly.


Attack: Automotive - V

An automotive attack assumes that the vehicle would be used as a weapon and would strike your asset directly. These threat scenarios do not include assault teams, only single VBIED (Vehicle Based Improvised Explosive Device).


Attack: Assault Team - AT

The assault team attack is more complex. It involves a lone assailant team of assailants with specific types of weapons, and various options for an approach..


Asset/Threat Matrix


Back to Table of Contents

Asset Threat Threshold Matrix

The threat-asset matrix page allows you to prioritize your threat-asset pairs. Each asset that lies at or above your asset threshold that was entered on the asset characterization page will be shown in the first column by the asset ID and name. The threats that you chose to include in your analysis will be listed across the top of the sheet by the hazard code. Each cell in the matrix is related to an asset and a threat. The value of the cell is the level of concern you have placed on that threat hitting that asset. Fill out the prioritization matrix for each asset by clicking in each box. The values are:

  1. Very Low
  2. Low
  3. Moderate
  4. High
  5. Very High

To save the your values entered into the matrix, click the Save changes box above Asset ID.

The Threat-Asset Threshold scroll-down is the value which you deem to be the lowest priority level that should be included in your analysis. The program will color any value box that is at or above your chosen value yellow. Those threat-asset pairs will move forward in the analysis.

Matrix Thresholds

The Threat Count number shows the number of threats shown in the matrix. They are only the threats that remain active from the Threat Characterization Page.

The Asset Count number shows the number of assets shown in the matrix. They are only the assets above the asset threshold you selected on the Asset Characterization page.

The Threat-Asset T/A Threshold Count shows you the number of threat-asset pairs that are at or above your selected Threat Asset Threshold. This is the number of threat-asset pairs that will move forward in the analysis and will have consequence, vulnerability, and threat values calculated.

To add/delete assets included, click Manage Assets. You will be directed back to the Asset Characterization page.

To add/delete threats included, click Manage Threats. You will be directed back to the Threat Characterization page.


Consequence Analysis of Malevolent Threats


Back to Table of Contents

This page evaluates the potential worst reasonable consequences of a malevolent attack on your critical assets. The consequences you will be analyzing are fatalities, serious injuries, financial impact to the owner, and economic impact to the served community.

Consequence analysis page

Editing Asset Consequences

To add consequence information to an asset, click the edit box Edit icon to the left of an asset. A pop-up window will appear and you will be able to edit the appropriate information.

Edit consequence analysis

Asset/Threat:: You will not be able to edit Asset and Threat information in this window. It is only displayed for reference.

Fatalities:: NOTE: If you elected to not include a statistical value of life and a statistical value of serious injury on the start-up page, this section will still appear on the page but will not be calculated into the final risk number. The statistical value of life is needed to calculate the potential impact of fatalities on your system on a monetary level.

The number of fatalities that are expressed here is the number that occurs within a short period of time after the attack and should not include fatalities that occur weeks later. This also includes fatalities both on-site and off-site.

To change the number of fatalities associated with a threat-asset pair, click inside the first editable box, and then type the number of expected fatalities from this attack.

Serious Injuries: NOTE: If you elected to not include a statistical value of life and a statistical value of serious injury on the start-up page, this section will still appear on the page but will not be calculated into the final risk number. The statistical value of serious injury is needed to calculate the potential impact of serious injuries on your system on a monetary level.

The number of serious injuries that are expressed here is the number that occurs within a short period of time after the attack and should not include serious injuries that are long term. Serious injuries that are to be included are any injury that would result in the loss of work time or disability. This includes serious injuries both on-site and off-site.

To change the number of serious injuries associated with a threat-asset pair, click inside the second editable box, and then type the number of expected serious injuries from this attack.

Duration and Severity:The duration and severity of the consequences give values to the length of time that the asset will be out of service and the amount of water that will not be delivered per day. The duration is defined as the number of days that the asset is out of service while waiting for repair or replacement. The severity is the number of million gallons per day (MGD) that will not be delivered to customers, given that the asset is not functioning. These values are used to calculate operational losses and will be included in the "Financial Total" column.

To change the duration that the asset will be non-functional, click inside the editable box labelled "Duration (Days), and then type the number of expected days the asset will be down.

To change the severity of the loss of the asset, in MGD, click inside the editable box, and then type the number of MGD lost through that asset.

Financial Impact:: The financial impact of an attack is an estimate of the financial losses to the owner of the asset or system for each threat-asset pair. This includes repair and replacement of any damaged or destroyed assets, business interruption costs, penalties for service interruption or environmental impacts, and any other costs directly related to the attack. This is also known as the Owner Indicator and the value is expressed in dollars.

To change the owner's financial impact associated with a threat-asset pair, click inside the next editable box, and then type the financial impact, in dollars, to the owner from this attack.

Economic Impact:: The economic impact of an attack on an asset is the monetary impact on the community or general public and is dependent on that length of time which the service in interrupted. This is also known as the Regional Indicator. This includes suppliers, customers, and anyone in the area of the assets' location that could be affected by an attack. Economic losses due to a disruption of service or physical damage should be included here. This value is expressed in dollars.

To change the community's economic impact associated with a threat-asset pair, click inside the last editable box, and then type the economic impact, in millions of dollars, to the served community from this attack.


When you have finished making your changes, click Update.

To cancel your changes and exit the edit box without saving, click Cancel.

Financial Total

The financial total column calculates the total financial impact including Owners financial impact, the calculated losses from the severity, duration, and commodity rate, and the monetary values of the losses of life and serious injuries (if applicable) to determine the financial total.


Vulnerability Analysis of Malevolent Threats


Back to Table of Contents

The vulnerability analysis of directed or malevolent threats determines the probability that a threat, given that it occurs, will overcome the countermeasures you have put into place and cause the damages you found in the consequence analysis. This section allows you to add a specific analysis to any given asset and also add any existing countermeasures against an attack on your system.

Vulnerability analysis page

To navigate to the vulnerability page, click the drop down menu for Direct Threats Analysis and select the Vulnerability tab.


Selecting an Analysis Type

There are three (3) methods that are available for determining the vulnerability of your assets to malevolent attacks:

To select an analysis from the Vulnerability Analysis page, click the edit icon Edit icon next to the desired threat-asset pair. A pop-up window will appear, and you will be asked to choose what type of analysis you would like to appoint to your threat-asset pair.

Click on the --Analysis Type-- pull-down and click on an analysis to choose.

Edit analysis type window

Click the Update Update button box. You will then be promted to begin the analysis through a series of steps. Each analysis method has a set of specific, required data that must be inputed in order to run. Review the steps for each analysis below.

Click Cancel to close the Edit Analysis window without saving.

Countermeasures

A countermeasure is an action, device, or physical element that reduces risk by affecting an asset, threat, or vulnerability. This section applies to all analysis types.

To add a countermeasure to a vulnerability analysis, click the New Countermeasure box. An Add Countermeasure pop-up will appear and you will be able to create a new countermeasure or add a countermeasure that you have already defined.

Countermeasures display

Adding an Existing Countermeasure

To add a countermeasure, click New Countermeasure.

Select countermeasure window

Once the pop-up appears, you will have two options. At this point, you may add a countermeasure that has already been defined (if this is not your first analysis), or create a new one. Once a countermeasure has been created, it is available for use in any of the vulnerability analysis types for the project and will not have to be created again. To add new countermeasure, click the New box. Another pop-up window will appear and you will be required to select a countermeasure type and add a description to your countermeasure:

New countermeasure window

Countermeasure Type:Select the type of countermeasure you would like to add. There are 18 predefined types ot countermeasures you may choose from:

Description: Here you may add any other additional information about the countermeasure, including model numbers, manufacturers, locations, etc.

Once you have entered the desired information, click Save. The countermeasure will automatically be added to the threat-asset pair analysis.

Once a countermeasure has been created, it is available for use in any of the vulnerability analysis types and will not have to be created again.

To remove countermeasures you had previously added to the threat-asset pair, click the delete box Close X button to the left of the countermeasure type.

To permenently delete a countermeasure from the entire project, click the edit Edit icon box next to the countermeasure type to re-open the add countermeasure window. You will be able to edit the countermeasure information, cancel, or delete the countermeasure from all analysis by clicking Permenently Delete.


Path Analysis

Path analysis breaks down the relationship between the amount of time it will take a threat to gain access to your asset and the amount of time it takes for a response team to stop the attack. The countermeasures are measured by detection, delay, and response and the vulnerability is determined by the time taken for each of these measurements.

Once you have the total response time and attack time, it is the responsibility of your team to determine the scale on which to rate them. Your final vulnerability number must be between 0 and 1.0.

Starting a Path Analysis

To begin the vulnerability analysis using a path analysis for a threat-asset pair, click the edit icon Edit icon next to the corresponding line. The box pictured below will appear. Choose Path Analysis from the drop-down menu for that threat asset pair, and then click Select.

Select path analysis window

You may either choose an existing path analysis that you have previously developed for another threat-asset pair, copy an existing analysis and make some changes, or create a new analysis.

To cancel your changes at any time, click Cancel. None of your work will be saved.

To choose an existing path analysis, click the pull down menu, then select the desired choice, and then click Select.

Select existing path analysis

All of the information previously entered will be displayed on the screen. Simply click Save to save your choice.

If you make changes to the indicator without copying it, the changes will apply to every threat-asset pair where that particular path analysis was chosen to be used.

To copy an existing path analysis to make a new version, click the pull down menu, select the desired choice to copy, and then click Copy.

Change the desired information, then click Save Analysis, then click Save. If you click Save before clicking Save analysis, your changes will NOT be saved.

To create a new path analysis, click New.

Create path analysis

Give your Path Analysis a name. Click inside the text box, and then type the desired name.

Click New. The Path Analysis will be created in the system and you can now input your countermeasures

Click Update to begin.

There are three parts to completing a path analysis. First, add the applicable countermeasures protecting the asset against the threat. Second you will add steps to the response path and attack path. Lastly, you will determine the vulnerability from the time results of the two paths.


Response Path

The response path in this path analysis includes the steps that would be taken from the time the adversary is detected, until the time the adversary is intercepted from carrying out his plan. This includes the time it takes to identify the problem, notify responders (police, security, etc.), travel time, and interception time once responders arrive on site.

To add a step to the response path, click New Response Path.

add path step

Give the step a name that describes what occurs during that step. Click inside the text box, and then type the desired name.

Determine the duration of that step. This is the total time, in minutes, it takes to complete the step. Click inside the text box, and then type the desired time.

Click Save when complete.

The Step Number describes the order in which the events occur. The number will populate for you automatically in chronological order. If you miss a step, click the check box on one step above or below where you want the new step to be. Click Insert Above Selection or Insert Below Selection to add in the new step. The following steps will adjust automatically.

To remove a step from the response path that you have previously added, click the Close X button button.

Continue to add steps until the total response path is recorded. An example is shown below.

Response path

The response step displays the order of events.

The step time displays the duration of each step.

The cumulative time displays the cumulative total time at each step, concluding with the final total response time (in this case, 16 minutes).


Attack Path

To add a step to the attack path, click New Attack Path.

Attack path

Countermeasure: The associated countermeasure that the attacker will be facing at each step.

Travel Time: The amount of time (in minutes) it takes for the attacker to reach the current countermeasure/the target AFTER he has overcome the previous one.

Overcome Time: The amount of time (in minutes) it takes for the attacker to overcome or defeat the countermeasure. Examples include time to break through a door, climb over a wall, or break a lock.

Assailant Detected?: This box is checked at the step where the attacker has been detected. At this point, the response time clock will start.

To choose a countermeasure, click the drop down menu, and then select the desired choice.

To edit the travel time or the overcome time, click inside the text box, and then type the desired number.

To identify that the attacker has been detected, click inside the checkbox labeled Assailant Detected?.

Click Save when complete.

To remove a step from the attack path that you have previously added, click the Close X button button.

Continue to add steps until the total attack path is recorded. An example is shown below.

View attack path

The Step Time displays the total amount of time it takes to complete that step. It is the sum of the travel time and the overcome time.

The Cumulative Time displays the cumulative total time at each step, concluding with the total attack time (22 minutes in this case)

The Response Time Remaining displays the amount of time until the responders are able to apprehend the attacker.

Color coding is as follows:

Once you have completed the analysis, you can use the Response Time Remaining value and apply it to the Optional Probability Values located in the top right of the page next to the Save and Close button. It is also listed below.

Select path analysis optional values

Expert Judgement

Direct expert judgement does not require any mathematical calculations or analyses to be entered into the PARRE program, but it is necessary to involve experts that are familiar with your assets as well as the threats that could affect them. Involving local, state, and federal agencies in discussions is recommended. Based on these discussions, you will input a value between 0 and 1.0 for each asset/threat pair.

Starting an Expert Eliclication Analysis

To begin the vulnerability analysis using direct expert judgement for a threat-asset pair, you will be asked to provide a calculated probability and add any countermeasures the asset has. You can also add notes for your own reference by typing in the Notes box under Probability.

Expert judgement window

To update the vulnerability value, click inside the Probability editable text box and then type the desired value.

To add a countermeasure to the asset's analysis, see Adding a Countermeasure.

To save your work, click Save & Close. You will return to the vulnerability analysis page

To edit the type of analysis an asset-threat pair has, click the edit Edit icon box to the left of the asset name column.

To edit the analysis itself, double-click on the analysis type box correlating to the desired asset. This will re-open the analysis window and you will be able to modify any of the information previously inputed.

Event Tree

An event tree uses the probabilities of success and failure rates of a threat attacking your assets.

Starting an Event Tree Analysis

Once an event tree is selected for the analysis type, you will either add a new event or select an existing event (one previously added).

Event trees

You may either choose an existing event tree that you have previously developed for another threat-asset pair, copy an existing tree and make some changes, or create a new tree.

To choose an existing event tree, click the pull down menu, select the desired choice, and then click Select. All of the information previously entered will be displayed on the screen. Simply click Save to save your choice. If you have already created an event tree, it will appear as an existing event tree (will appear in the Select Existing scroll-down) and, if chosen, will copy the entire event tree to your asset. This copy can be identified by the copy number added to the end (eg. (1) ). Find an existing tree in the scroll-down, click copy, then click Update to bring up the event window to edit/add/delete nodes.

To create a new path analysis, click New.

Creating an event tree name

Give your Event Tree a name. Click inside the text box, and then type the desired name.

Click Save. The Event Tree will be created in the system and you can now input your countermeasures

Click Update to begin.

There are three parts to completing an event tree. First, add the applicable countermeasures protecting the asset against the threat. Second you will add steps to the event tree. Lastly, you will determine the vulnerability from the product of all events in the event tree.


Creating the steps in an event tree

Click the Start box to begin adding nodes to your event path. Each node should be a countermeasure the assailant will have to overcome to successfully carry out their mission. With each node you add, you will need to create a success name, failure name, and success probability.

Creating the steps in an event tree

Success Name: Click inside the text box, then type name you would like to use for the successful branch. This is the action taken by the attacker that would succeed in overcoming a countermeasure.

Failure Name: Click inside the text box, then type the name you would like to use for the failure branch. This is the action taken by the attacker that would fail in overcoming a countermeasure.

Success Probability: Click inside the text box, then type the probability between 0 and 1.0 that the attacker will succeed in overcoming the countermeasure.

You can add, edit, and delete nodes by clicking on a node. To add a new node to your tree, double-click the node you would like to add on to. The node box will pop up and you will need to click New to add a node branch to a node.

Creating the steps in an event tree

As branches are added to the event, the probability of that event happening is calculated and displayed above the tree display box.

To re-center the path in the event window, click the Re-Center Diagram next to the calculated probability display.

The Vulnerability of the assessed threat asset pair is shown at the top of the screen at all times next to Calculated Probability.

To save and close this page, click the Go Back to Vulnerability Analysis button in the top right of the page.


Threat Analysis


Back to Table of Contents

Threat analysis evaluates the probability that a threat will occur against an asset within one year.

Selecting an Analysis Type

There are three (3) methods that are available for determining the threat likelihood of your assets to malevolent attacks:

To select an analysis from the Threats Likelihood page, click the edit icon Edit icon next to the desired asset. A pop-up window will appear, and you will be asked to choose what type of analysis you would like to appoint to your asset.

Click on the --Analysis Type-- scroll bar and click on an analysis to choose.

Edit analysis type

Click Update to save the analysis type and close the Edit Analysis window.

Click Cancel to close the Edit Analysis window without saving.


Best Estimate

The best estimate threat likelihood does not involve any required procedures. This value between zero and one is determined based on informed opinions from law enforcement, intelligence agencies, and/or the professional opinions of your group.

Choose Best Estimate from the drop-down menu for that threat asset pair. This action is accessed by clicking the edit Edit icon box next to the asset-threat pair.

Best estimate

Once a best estimate is selected for the analysis type, all you are required provide is a desired threat likelihood as a probability. Click inside the --Enter Probability-- box, and then type the desired threat likelihood as a probability between 0 and 1.0.

Click Update when finished.

To exit without saving your choice, click Cancel.


Conditional Probability

When using conditional probabilities, you will be assuming that the likelihood of every threat occurring within one year and inflicting damage is 100%. The threat likelihood for every threat-asset pair is 1, or 100%.

Choose Conditional Risk from the drop-down menu for that threat asset pair. This action is accessed by clicking the edit Edit icon box next to the pair.

Conditional risk update

Click Update to continue the analysis.

The probability will be automatically defaulted to 1, with no ability to edit the probability.

To exit without saving your choice, click Cancel.


Proxy Indicator

The proxy indicator method for determining the threat likelihood for a malevolent threat attacking your assets is a holistic approach developed by RAND Corporation and Risk Management Solutions, Inc. This process determines the probability, based on the attractiveness of a target, of a terrorist type attack. You will answer a few questions about the location of your facility/system to determine the threat likelihood.

Choose Proxy Indicator from the drop-down menu for that threat asset pair. This action is accessed by clicking the edit Edit icon box next to the asset-threat pair.

Select proxy indicator

You may either choose an existing proxy indicator that you have previously developed for another threat-asset pair (if this is not your first analysis), copy an existing analysis and make some minor changes, or create a new analysis.

To create a new proxy indicator, click New. The following window will appear and you will be able to imput the cooresponding information:

Proxy indicator

Name: Give your Proxy Indicator analysis a name. Click inside the text box, and then type the desired name.

Description: Give your Proxy indicator a description. You may use any description that will help you identify it from other indicators. Click inside the text box, and then type the desired description.

Attacks in U.S.: The first node is the number of attacks in the US (per year). The value defaults to 4. User will have to click in the text box if they want something other than 4.

Metro Region: Select your metro region by clicking the pull down menu, and then selecting your region from the list. If your facility is not located in one of these metro regions, select Other. If you selected Other, then you must give the population of your metro region. If you selected one of the pre-determined regions, then you will not enter a population. Click inside the text box, and then type the population of your metro region.

Target Type: Select the target type of your facility clicking the pull down menu and then selecting your type of facility. If you are evaluating a water treatment plant, you should select the industrial facilities option. If you are evaluating source water/distribution system, you should select water reservoirs and distribution option.

Facilities of Target Type: Enter the estimated number of facilities located within your metro region that match the same broad target type you selected. Click inside the text box, and then type the number of facilities.

Facilities of Sub Type: Enter the number of facilities of your subtype within the broad target type you selected. This number will not be more than the number in the Facilities of Target Type box. Click inside the text box, and then type the number of facilities of your subtype.

Facility Capacity: Enter the capacity of your facility. This may be the MGD you produce. Click inside the text box, and then type the capacity.

Regional Capacity: Enter the capacity of all facilities of your subtype in your region. This number will not be greater than the Facility Capacity. Click inside the text box, and then type the capacity.

When finished entering the above data, click Save Indicator and then click Update to continue the analysis.

To cancel your changes at any time, click Cancel. None of your work will be saved.

To choose an existing proxy indicator, click the pull down menu then select the desired choice. All of the information previously entered will be displayed on the screen. You can edit this analyses information or copy the analysis and then modify the information to create a different analysis.

If you make changes to the indicator without copying it, the changes will apply to every threat-asset pair where that particular proxy indicator was chosen to be used.

To copy an existing proxy indicator to make a new version, click the pull down menu, select the desired choice to copy, and then click Copy. Change the desired information, click Save, then click Update.


Natural Threat Analysis


Back to Table of Contents

Natural threat analysis is performed differently than malevolent or dependency and proximity threat analysis. The ANSI/AWWA J-100 standard outlines specific methods for determining the risk of each natural hazard based on your location. The natural hazards that are required to be analyzed are hurricanes, earthquakes, tornadoes, floods, wildfires, and ice storms.

To begin an evaluation of a natural hazard threat-asset pair, double click on the desired pair you would like to evaluate. Steps on how to complete the analysis are broken down by threat below.


Hurricanes

The method used to evaluate the risk to your assets from hurricanes is detailed in the AWWA J100 Standard. You can use the calculator built into PARRE to evaluate hurricane risk, or you can manually input consequence, vulnerability, and threat likelihood values based on a method of your choice.

Hurricane input

If you would like to utilize the natural hazard calculator in PARRE, you will need to fill out the information on the right side of the screen.

The replacement cost and damage factor are populated for you based on the information you gave in the asset characterization screen.

First, Enter the duration, in days, that the asset would reasonably be down for each category if a hurricane struck the asset by clicking in the text box and entering the value.

Second, The severity, in MGD, of the outage for the asset is entered in the next text box for each category of hurricane.

Next, enter the number of fatalities that would reasonably occur for each category if a hurricane struck the asset by clicking in the text box and entering the value.

Enter the number of serious injuries that would reasonably occur for each category if a hurricane struck the asset by clicking in the text box and entering the value.

Select the design speed, in mph, in the drop down box. The design speed is the wind speed that your asset was built to withstand. This is usually equal to or greater than the design speed detailed in your building codes.

The hurricane profile is created in order to gather information needed for the calculator. The information gathered here, combined with other data in the database, will calculate the financial impacts, vulnerability, threat likelihood, and risk for you.

To choose an existing profile, click the drop-down menu, and then choose the desired profile. You should only have to create one profile for the project, unless your assets are spread out over a large area.

To edit an existing profile, click Edit Selected Profile.

For the first use of the calculator, or to add a new profile, click Add New Profile. The following screen will appear:

Hurricane profile

In the text box at the top of the page, type a name for the hurricane profile.

Next, enter the return period, in years, for each category of hurricane for your area. Maps containing this information are located in the J100 Standard. You can also access the maps by clicking the links to the right of the text box.

If you would like to make this profile a default profile, check the box labelled Make Default. If you make a profile the default profile, it will automatically populate in the calculator.

Once the information in the calculator is populated, click Calculate. The consequences, vulnerability, threat likelihood, and risk values will calculate for you. The results will be for each Category, and the total value is summarized in the bottom row.

Hurricane total

When finished, click Save. To discard your work, click Close

If you would like to enter your own values for financial impact, vulnerability, and threat likelihood, check the box labelled Manual Calculations, and then enter the desired values in the designated text boxes. The manually calculate button is only active if you choose to enter your own values.

Hurricane calculator

First, enter the number of fatalities that would reasonably occur if a hurricane struck the asset by clicking in the text box and entering the value.

Second. enter the number of serious injuries that would reasonably occur if a hurricane struck the asset by clicking in the text box and entering the value.

Next, Enter the duration, in days, that the asset would reasonably be down if a hurricane struck the asset by clicking in the text box and entering the value.

The severity, in MGD, of the outage for the asset is entered in the next text box for each category of hurricane.

Next, add the economic impact to the community that would reasonably occur due to a hurricane striking the asset, in dollars, can be entered.

Next, add the financial impact to the utility that would reasonably occur due to a hurricane striking the asset, in dollars, can be entered.

Add the Vulnerability. The vulnerability is a value between 0 and 1 indicating the ability of the asset to resist the hurricane.

Add the Threat Likelihood. The threat likelihood is the probability the hurricane will occur in a given year between 0 and 1.

When you are finished calculating the risk to hurricanes, click Manually Calculate and Update. To discard your work, click Cancel.


Earthquakes

The method used to evaluate the risk to your assets from earthquakes is detailed in the AWWA J100 Standard. You can use the calculator built into PARRE to evaluate earthquake risk, or you can manually input consequence, vulnerability, and threat likelihood values based on a method of your choice.

Earthquake input

If you would like to utilize the natural hazard calculator in PARRE, you will need to fill out the information on the right side of the screen. The information needed is located in the following section:

The replacement cost, damage factor, and year built are populated for you based on the information you gave in the asset characterization screen.

For the first use of the calculator, or to add a new profile, click Add New. Add a name for this profile and click Update. The following screen will appear:

Earthquake profile

The earthquake profile is created in order to gather information needed for the calculator. The information gathered here, combined with other data in the database, will calculate the financial impacts, vulnerability, threat likelihood, and risk for you.

To begin creating the earthquake profile, name the profile and begin entering the data.

After you have determine the probability of each magnitude earthquake listed in the data box occurring in your area, type the return period used for the probabilities. Generally, the return period reported by USGS is 50 years.

Determine the Seismic Zone that the asset is located in and select the corresponding answer in the drop down menu.

Lastly, input the probabilities of each magnitude earthquake with values between 0 and 1.

If you would like to make this profile a default profile, check the box labelled Default Profile?. If you make a profile the default profile, it will automatically populate in the calculator.

To choose an existing profile, click the drop-down menu, and then choose the desired profile. You should only have to create one profile, unless your assets are spread out over a large area.

To edit an existing profile, click Edit Selected Profile.

When finished, click Update. To discard your work, click Close.

Enter the duration, in days, that the asset would reasonably be down if an earthquake of each magnitude struck the asset by clicking in the text box and entering the value.

The severity, in MGD, of the outage for the asset is entered in the next text box. Input the severity for each magnitude earthquake.

Next, enter the number of fatalities that would reasonably occur if an earthquake of each magnitude struck the asset by clicking in the text box and entering the value.

Enter the number of serious injuries that would reasonably occur if an earthquake of each magnitude struck the asset by clicking in the text box and entering the value.

Finally, the economic impact to the community that would reasonably occur due to an earthquake striking the asset, in dollars, can be entered on the left hand side of the calculator.

The operational losses, in dollars, that you would incur from the asset being non-functional are calculated using the commodity rate provided on the first page. These values are included in the consequences.

Once the information in the calculator is populated, click Calculate. The consequences, vulnerability, threat likelihood, and risk values will calculate for you.

Earthquake total

When you are finished calculating the risk to earthquakes, click Update. To discard your work, click Cancel.

If you would like to enter your own values for financial impact, vulnerability, and threat likelihood, check the box labelled Manual Calculations on the left hand side of the screen, and then enter the desired values in the designated text boxes. The calculate button turns into the Calculate Manually button only if you choose to enter your own values.

Earthquake manual input

First, enter the number of fatalities that would reasonably occur if an earthquake struck the asset by clicking in the text box and entering the value.

Second. enter the number of serious injuries that would reasonably occur if an earthquake struck the asset by clicking in the text box and entering the value.

Next, Enter the duration, in days, that the asset would reasonably be down if an earthquake struck the asset by clicking in the text box and entering the value.

The severity, in MGD, of the outage for the asset is entered in the next text box.

Next, add the economic impact to the community that would reasonably occur due to an earthquake striking the asset, in dollars, can be entered.

Next, add the financial impact to the utility that would reasonably occur due to an earthquake striking the asset, in dollars, can be entered.

Add the Vulnerability. The vulnerability is a value between 0 and 1 indicating the ability of the asset to resist the earthquake.

Add the Threat Likelihood. The threat likelihood is the probability the earthquake will occur in a given year between 0 and 1.

When you are finished calculating the risk to earthquake, click Manually Calculate and Update. To discard your work, click Cancel.


Tornadoes

The method used to evaluate the risk to your assets from tornadoes is detailed in the AWWA J100 Standard. You can use the calculator built into PARRE to evaluate tornado risk, or you can manually input consequence, vulnerability, and threat likelihood values based on a method of your choice. Regardless of the method you choose, there is some information that should be entered.

Tornado manual input

General information about the asset are located in the top left of the box. The latitude and longitude as well as the county and state where the asset is located is also populated for you.

First, enter the number of fatalities that would reasonably occur if a tornado struck the asset by clicking in the text box and entering the value.

Second, enter the number of serious injuries that would reasonably occur if a tornado struck the asset by clicking in the text box and entering the value.

Next, Enter the duration, in days, that the asset would reasonably be down if a tornado struck the asset by clicking in the text box and entering the value.

The severity, in MGD, of the outage for the asset is entered in the next text box.

Finally, the economic impact to the community that would reasonably occur due to a tornado striking the asset, in dollars, can be entered.

On the right hand side of the screen is the operational loss, replacement cost, and damage factor. The operational loss is a calculation using the duration and severity as well as the blended comodity rate inputed in the project description page on the Projects page. The replacement cost and damage factor are populated for you based on the information provided in the asset characterization screen.

Once the information in the calculator is populated, click Calculate. The consequences, vulnerability, threat likelihood, and risk values will calculate for you.

If you would like to enter your own values for financial impact, vulnerability, and threat likelihood, check the box labelled Manual Calculation, and then enter the desired values in the designated text boxes. When finished, click Calculate Manually. The calculate button turns into the Calculate Manually button only if you choose to enter your own values.

First, enter the number of fatalities that would reasonably occur if a tornado struck the asset by clicking in the text box and entering the value.

Second. enter the number of serious injuries that would reasonably occur if a tornado struck the asset by clicking in the text box and entering the value.

Next, Enter the duration, in days, that the asset would reasonably be down if a tornado struck the asset by clicking in the text box and entering the value.

The severity, in MGD, of the outage for the asset is entered in the next text box.

Next, add the economic impact to the community that would reasonably occur due to a tornado striking the asset, in dollars, can be entered.

Next, add the financial impact to the utility that would reasonably occur due to a tornado striking the asset, in dollars, can be entered.

Add the Vulnerability. The vulnerability is a value between 0 and 1 indicating the ability of the asset to resist the tornado.

Add the Threat Likelihood. The threat likelihood is the probability the tornado will occur in a given year between 0 and 1.

When you are finished calculating the risk to Tornadoes, click Manually Calculate and Update. To discard your work, click Cancel.

When you are finished calculating the risk to tornadoes, click Update. To discard your work, click Cancel.


Floods

The method used to evaluate the risk to your assets from flooding is detailed in the AWWA J100 Standard. You can use the calculator built into PARRE to evaluate flood risk, or you can manually input consequence, vulnerability, and threat likelihood values based on a method of your choice. Regardless of the method you choose, there is some information that should be entered.

Flood manual input

If you would like to use the calculator built into PARRE to evaluate flood risk, you will be using the right side of the screen.

First, If the asset is vulnerable to floods, and is located in the 100-year flood plain, click the box labelled Is Asset in Flood Plain?.

Second, enter the number of fatalities that would reasonably occur if a flood struck the asset by clicking in the text box and entering the value.

Then, enter the number of serious injuries that would reasonably occur if a flood struck the asset by clicking in the text box and entering the value.

Next, Enter the duration, in days, that the asset would reasonably be down if a flood struck the asset by clicking in the text box and entering the value.

The severity, in MGD, of the outage for the asset is entered in the next text box.

Finally, on the left hand side, the economic impact to the community that would reasonably occur due to a flood striking the asset, in dollars, can be entered.

The operational losses, in dollars, is calculated using the duration and severity as well as the blended comodity rate inputed in the project description page on the Projects page. The replacement cost and damage factor are populated for you based on the information provided in the asset characterization screen.

Once the information in the calculator is populated, click Calculate. The consequences, vulnerability, threat likelihood, and risk values will calculate for you.

Flood total

When you are finished calculating the risk to flooding, click Update. To discard your work, click Cancel.

Flood calculator

If you would like to enter your own values for financial impact, vulnerability, and threat likelihood, check the box labelled Manual Calculations, and then enter the desired values in the designated text boxes. The calculate button turns into the Calculate Manually button only if you choose to enter your own values.

First, enter the number of fatalities that would reasonably occur if a flood struck the asset by clicking in the text box and entering the value.

Second. enter the number of serious injuries that would reasonably occur if a flood struck the asset by clicking in the text box and entering the value.

Next, Enter the duration, in days, that the asset would reasonably be down if a flood struck the asset by clicking in the text box and entering the value.

The severity, in MGD, of the outage for the asset is entered in the next text box.

Next, add the economic impact to the community that would reasonably occur due to a flood striking the asset, in dollars, can be entered.

Next, add the financial impact to the utility that would reasonably occur due to a flood striking the asset, in dollars, can be entered.

Add the Vulnerability. The vulnerability is a value between 0 and 1 indicating the ability of the asset to resist the flood.

Add the Threat Likelihood. The threat likelihood is the probability the flood will occur in a given year between 0 and 1.

When you are finished calculating the risk to floods, click Manually Calculate and Update. To discard your work, click Cancel.


Wildfire

The method used to evaluate the risk to your assets from wildfires is not detailed in the AWWA J100 Standard. AEM Corperation has developed a method to assess wildfires and has included it in the software. This method evaluates the consequences, vulnerabilities, and threat likelihoods for both a minor and major wildfire and combines them into a single threat. For this reason, we will need to input consequences and vulnerabilities for both minor and major wildfires. You can also manually input consequence, vulnerability, and threat likelihood values based on a method of your choice.

You will need to follow the same steps below for minor and major wildfires.

Wildfire manual input

First, enter the repair/replacement cost of the asset and the additional treatment cost required if a minor wildfire struck the asset.

Second, enter the number of fatalities that would reasonably occur if a minor wildfire struck the asset by clicking in the text box and entering the value.

Then, enter the number of serious injuries that would reasonably occur if a minor wildfire struck the asset by clicking in the text box and entering the value.

Next, Enter the duration, in days, that the asset would reasonably be down if a minor wildfire struck the asset by clicking in the text box and entering the value.

The severity, in MGD, of the outage for the asset is entered in the next text box.

The operational losses, in dollars, is calculated using the duration and severity as well as the blended comodity rate inputed in the project description page on the Projects page.

Wildfire vulnerability 1
Wildfire vulnerability 2

Next, the system will calculate the vulnerability based on the answers to six questions.

When you have answered these questions, continue scrolling down and repeat the process for major wildfires.

After the major wildfire section, we will now calculate our threat likelihood. Click on the ecoregion divisions map (also shown below), determine where your asset is located, and press the Close button. Select that ecoregion from the drop down map and enter the area of the watershed for the asset.

Wildfire ecoregions

Finally, the economic impact to the community that would reasonably occur due to a wildfire striking the asset, in dollars, can be entered on the left hand side.

When you are finished inputing values, press the calculate button, and a results table will appear as shown below.

Wildfire calculator

If you would like to enter your own values for financial impact, vulnerability, and threat likelihood, check the box labelled Manual Calculations, and then enter the desired values in the designated text boxes. The calculate button turns into the Calculate Manually button only if you choose to enter your own values.

First, enter the number of fatalities that would reasonably occur if a wildfire struck the asset by clicking in the text box and entering the value.

Second. enter the number of serious injuries that would reasonably occur if a wildfire struck the asset by clicking in the text box and entering the value.

Next, Enter the duration, in days, that the asset would reasonably be down if a wildfire struck the asset by clicking in the text box and entering the value.

The severity, in MGD, of the outage for the asset is entered in the next text box.

Next, add the economic impact to the community that would reasonably occur due to a wildfire striking the asset, in dollars, can be entered.

Next, add the financial impact to the utility that would reasonably occur due to a wildfire striking the asset, in dollars, can be entered.

Add the Vulnerability. The vulnerability is a value between 0 and 1 indicating the ability of the asset to resist the wildfire.

Add the Threat Likelihood. The threat likelihood is the probability the wildfire will occur in a given year between 0 and 1.

Wildfire manual input

When you are finished calculating the risk to floods, click Manually Calculate and Update. To discard your work, click Cancel.

When you are finished calculating the risk to wildfires, click Save. To discard your work, click Cancel.


Ice Storms

The method used to evaluate the risk to your assets from ice storms is developed internally by AEM Corporation, due to a lack of a defined method in the J100 Standard. You can use the calculator built into PARRE that utilizes the developed method to evaluate ice storm risk, or you can manually input consequence, vulnerability, and threat likelihood values based on a method of your choice. Regardless of the method you choose, there is some information that should be entered.

If you would like to utilize the natural hazard calculator in PARRE, you will need to fill out the information on the right side of the screen. The additional information needed is located in the following section:

Ice storms calculator

The latitude, longitude, and state are populated for you based on the information provided.

Next, enter the number of days you have of back-up power for the asset. This is most likely in the form of an on-site generator.

The next item is the daily loss though the asset in MGD if no backup power were available. The software will calculate the dollar value associated with this loss.

Finally, you will enter the recovery time, fatalities, and serious injuries that would reasonably be incurred if an ice storm of categories 3, 4, or 5 struck the asset. The recovery time is the time is takes for the asset to return to full function after being down for a specified amount of time. Descriptions of each category are as follows:

To enter the information, click inside each text box, and enter the desired values.

Once the information in the calculator is populated, click Calculate. The fatalities, serious injuries,consequences, vulnerability, threat likelihood, and risk values will calculate for you.

Ice storms manual input

If you would like to enter your own values for financial impact, vulnerability, and threat likelihood, check the box labelled Manual Calculations on the left hand side of the screen, and then enter the desired values in the designated text boxes. The calculate button turns into the Calculate Manually button only if you choose to enter your own values.

Earthquake manual input

First, enter the number of fatalities that would reasonably occur if an ice storm struck the asset by clicking in the text box and entering the value.

Second. enter the number of serious injuries that would reasonably occur if an ice storm struck the asset by clicking in the text box and entering the value.

Next, Enter the duration, in days, that the asset would reasonably be down if an ice storm struck the asset by clicking in the text box and entering the value.

The severity, in MGD, of the outage for the asset is entered in the next text box.

Next, add the economic impact to the community that would reasonably occur due to an ice storm striking the asset, in dollars, can be entered.

Next, add the financial impact to the utility that would reasonably occur due to an ice storm striking the asset, in dollars, can be entered.

Add the Vulnerability. The vulnerability is a value between 0 and 1 indicating the ability of the asset to resist the ice storm.

Add the Threat Likelihood. The threat likelihood is the probability the ice storm will occur in a given year between 0 and 1.

When you are finished calculating the risk to ice storms, click Manually Calculate and Update. To discard your work, click Cancel.

Ice storm total

When you are finished calculating the risk to ice storms, click Update. To discard your work, click Cancel.


Dependency and Proximity Threat Analysis


Back to Table of Contents

Dependency and proximity threat analysis is performed differently than natural or malevolent threat analysis. The dependency threats that can be analyzed are loss of utilities, loss of suppliers, loss of employees, loss of customers, and loss of transportation. The proximity of your assets to other potential targets is the only proximity hazard that could be considered.

To edit a threat asset pair, click the Edit icon edit button next to the desired pair and the below screen will appear.

Dependency edit

Fatalities

NOTE: If you elected to not include a statistical value of life and a statistical value of serious injury on the start-up page, this section will still appear on the page but will not be calculated into the final risk number. The statistical value of life is needed to calculate the potential impact of fatalities on your system on a monetary level.

The number of fatalities that are expressed here is the number that occurs within a short period of time after the attack and should not include fatalities that occur weeks later. This also includes fatalities both on-site and off-site.


Serious Injuries

NOTE: If you elected to not include a statistical value of life and a statistical value of serious injury on the start-up page, this section will still appear on the page but will not be calculated into the final risk number. The statistical value of serious injury is needed to calculate the potential impact of serious injuries on your system on a monetary level.

The number of serious injuries that are expressed here is the number that occurs within a short period of time after the attack and should not include serious injuries that are long term. Serious injuries that are to be included are any injury that would result in the loss of work time or disability. This includes serious injuries both on-site and off-site.


Duration and Severity

The Duration and severity of the consequences give values to the length of time that the asset will be out of service and the amount of water that will not be delivered per day. The duration is defined as the number of days that the asset is out of service while waiting for repair or replacement.

The Severity is the number of million gallons per day (MGD) that will not be delivered to customers, given that the asset is not functioning. These values are utilized in the service interuption costs in the financial total as well as the resilience calculations shown on the Risk/Resilience Analysis page of PARRE.


Financial Impacts

The Owner's Financial Impact of an attack is the monetary amount that would need to be spent in order to repair the damaged assets that were affected by the attack. This value is expressed in dollars.

The Community's Economic Impact of an attack is the monetary amount that the served community would suffer due to an inability to do business as a result of an inability to deliver water because the asset is non-functional


Vulnerability

Vulnerability is defined by the J100 as an estimate of the likelihood that each specific threat or hazard, given that it occurs, will overcome the defenses of each critical asset to the level identified in the consequences estimate for that threat-asset combination .


Threat Likelihood

Threat likelihood is defined by the J100 as an estimate of the probability that a particular attack will occur within a given time frame (usually one year).


Financial total

The Financial total, in dollars, is the sum of the owners impact, service loss (using severity, duration, and the commodity rate), and the dollar value equivalent for fatalities and serious injuries (if elected to include in your project).


Total Risk

The Risk, in dollars, for the threat-asset pair is the product of the financial total, vulnerability, and threat likelihood. It is considered to be the risk to the specific asset, from the specific threat, in any given year.


Adding a Category to Suppliers or Utilities

Assets may sometime rely on multiple suppliers or utilities to maintain operation. To add a category, click the Add Category button. The below box will appear, and you will be able to perform your analysis on that category.

Dependency category

Resilience


Utility Resilience Index (URI) Questions

Back to Table of Contents

This page contains the URI questions to determine the utility's system resilience. The URI questions are broken down into two sections: Financial and Operational. The total URI score is displayed at the top of the page. To answer each of the questions, click on the edit button on the desired line. An example of the pop-up that appears is:

Edit URI

Utilizing the pull-down choices, choose the answer that best applies to your facility. The option value and weight will automatically populate. The existing values and weights are populated based on the J100 Standard weights. If you would like to change the weights, you may change them by clicking in the appropriate text box, and entering the desired weight. NOTE: If you choose to change the weights, you must change the weights of the other questions as well to achieve a total sum for all questions of 100.


Summary


Back to Table of Contents

This page contains the summary of your analysis. This table combines the man-made, natural, dependancy and proximity results into one table. This table is able to be sorted by any category, but can also be copied into excel.


Risk & Resilience Management


Back to Table of Contents

The risk and resilience management page allows you to complete a benefit-cost analysis for proposed countermeasures. New options for countermeasures, or groups of countermeasures, are added here. The display shows the risk values for the baseline.

Add/Edit Option(s)

Once you have completed your baseline, you can create options. Options consist of one or more proposed countermeasures that you would like to evaluate. To add an option, click Add/Edit Option(s) in the top left hand of the page, and then select or create an option. After clicking New, you will be asked to name your option. Use a name that you will be able to recognize. You are also given the option to add a description of the option.

Option name

To name the option, click in the text box, and then type the name.

To add a description, click in the second text box, and then type a description. When finished, click Create Option.

NOTE: Once you add an option, you will create a copy of the baseline assessment. If you make any changes to the baseline assessment after the creation of an option, you must also manually make those changes in the options.

R&R warning

After clicking continue, you will be able to add the countermeasures associated with each option. Click New Countermeasure.

After clicking New Countermeasure, either select a countermasure you have already created from the drop down menu, or click New.

Proposed measures

Select the type of countermeasure. Click in the first text box, and then select the applicable option.

Add a detailed description, click in the second text box, and then type the desired description.

If there is an initial capital cost, type the cost in the text box.

Enter the effective life of the countermeasure by typing the value, in years, in the text box.

Type a desired inflation rate, in percent, over the life of the countermeasure in the last text box.

If there are annual maintenance costs, type the annual cost in the final text box. When finished, click Save.

R&R edit option

To edit your analysis with your proposed countermeasures, return to the Projects tab. For the project that you have created the countermeasures for, click the arrow button on the far left. This will drop down the proposed options you have created. It also shows you the Annual Cost, Gross Benefits, Net Benefits, and B/C Ratio. On the option you want to edit, click Open Option.

At this point you will adjust any consequence, vulnerability, or threat likelihood values that would be affected by the proposed countermeasures. To view the results of your changes, simply return to the Risk and Resilience Management page of PARRE and it will show the calculated risk values for the original assessment, the risk values any proposed options you have created, and the change in risk values from the options. At the bottom of the page, the Annual Gross Benefits, Annual cost, Net Benefits, and B/C Ratio are shown.

NOTE: Calculations for B/C Ratio in the Web version of PARRE use a different algorithm than that of the desktop version of PARRE, therefore, B/C Ratio values may not match after importing a desktop project into the Web version of PARRE.

To edit a countermeasure you already added, on the R&R Management tab, click Add/Edit Option(s). Select the option, and click the edit button.

To remove a countermeasure you already added, on the R&R Management tab, click Add/Edit Option(s). Select the option, and click the delete button.


B/C Ratio

The benefit-cost (B/C) ratio and net benefit are calculated for you based on the changes you made to the option analysis with the proposed countermeasures in place. In the risk and resilience management page, the option information is displayed in two columns next to the baseline information. To the right of the baseline value is the option risk value. The next column contains the difference between those two risk values. If there is a beneficial change in the risk, then the box will be green and the positive delta will display. If there is no change, the box will remain blue and the value inside will be zero (0). If there is a negative change between the baseline and the option, the box will be red and the negative value will display. Below is an image showing the various changes.

Delta of risk

Additional columns will appear to the right of the exiting ones as you add more options to the analysis.

The total gross benefits of each option, along with the present value cost, net benefit, and B/C ratio are displayed at the bottom of the page. The total gross benefits are calculated as the sum of the "change" column for that option.

Annual gross benefits refers to the total dollar amount of improvements that the option provides for the system.

Annual Cost is the one-year cost of the investment as calculated by the Equivalent Actual Cost (EAC) equation. This allows the user to compare annual reductions in risk to annual costs of improvements.

Net benefits is the difference between the annual gross benefits, and annual cost.

The B/C ratio helps determine if the option is beneficial to the system, or if its cost is more than the benefits. If this value is greater than 0, it has greater benefits than costs, but if this number is less than 0, the costs are greater than the benefits.


Appendix


Glossary

Back to Table of Contents

Definitions provided in this section are intended to clarify this document and to provide support in the use of PARRE. Most terms may also be found in the J100 standard.

Asset: An item of value or importance that if targeted, exploited, destroyed, or incapacitated could result in injury, death, economic damage to the owner of the asset or to the community it serves, destruction of property, or could profoundly damage a nation's prestige and confidence. Assets may include physical elements (tangible property), cyber elements (information and communication systems), and human or living elements (critical knowledge and functions of people).

Human: An employee or other critical person to the operation and management of a system.

External: An asset that is not a direct asset of the studied system and may include utilities and suppliers.

Physical: Any asset that is physically owned, operated, and maintained by the facility being analyzed.

Conditional Threat Analysis: Assumes that the likelihood of a malevolent threat attacking an asset is 100 percent. This type of analysis puts more weight on the consequences of the attack and vulnerability of an asset.

Consequence: The immediate, short- and long-term effects of a malevolent attack or natural incident. These effects include losses suffered by the owner of the asset and by the community served by that asset. They include human and property loses, environmental damages, and lifeline interruptions. Property damage and losses from interruption of operations are expressed in monetary units.

Consequence Mitigation: A series of planned and coordinated actions or system features designed to: reduce or minimize the damage caused by attacks (consequences of attack); support and compliment emergency forces (first responders); facilitate field-investigation and crisis management; and facilitate rapid recovery and reconstitution. May also include steps taken to reduce short- and long-term consequences, such as providing alternative sources of supply for critical goods and services. Mitigation actions and strategies are intended to reduce the consequences of an incident, whereas countermeasures are intended to reduce the consequences of an incident, whereas countermeasures are intended to reduce the probability that an attack will occur or will cause a failure or significant damage if it occurs.

Countermeasure: An action, device, or physical element that reduces risk by affecting an asset, threat, or vulnerability. Countermeasures may be directed at providing detection, deterrence, devaluation, delay, or response. Often used in conjunction with other security actions to create a more comprehensive and holistic security system and may incorporate consequence mitigation.

Critical Asset: An asset whose absence or unavailability would significantly degrade the ability of a utility to carry out its mission or would have unacceptable financial, political, or environmental consequences for the owner or community.

Dependency: The reliance of an asset, system, network, or collection thereof, within or across sectors, on input, interaction, or other requirement from other sources in order to perform mission objectives.

Dependency Hazard: A dependency the denial of which has the potential to disrupt the function of the asset, system, etc.

Direct Expert Judgement: Members of the evaluation team who are familiar with a facility's layout and work flows and are knowledgeable about the asset discuss the likelihood of success and their reasoning for their estimates.

Event Tree Analysis: An inductive analysis process that utilizes a graphical "tree" constructed to analyze the logical sequence of the occurrence of events in, or states of, a system following an initiating event.

Failure Mode: A way that failure can occur, described by the means or underlying physics by which element or component failures must occur to cause loss of the subsystem or system function.

Fault Tree Analysis: A deductive, binary logic diagram that depicts how a particular undesired event can occur as a logical combination of other undesired events.

Frequency: The rate of occurrence that is measured by the number of events per unit time, in this context, usually one year unless otherwise specified, or in a particular number of iterations, e.g., one defect per million products.

Function: The action or activity that an asset or facility performs which is critical to operation or providing services to customers.

Hazard: Something that is potentially dangerous or harmful, often the root cause of an unwanted outcome.

Incident: An occurrence or event (natural or human caused) that requires an emergency response to protect life or property. Incidents can, for example, include major disasters, emergencies, terrorist attacks, terrorist threats, wildfires, floods, hazardous materials spills, nuclear accidents, aircraft accidents, earthquakes, hurricanes, tornadoes, tropical storms, war-related disasters, public health and medical emergencies, power outages, and other occurrences requiring an emergency response.

Initiating Event: An event that appears at the beginning of a chain of events, such as in an event tree or failure tree. In this context, generally includes malevolent attacks, accidents, natural hazards, failure of key dependencies, or disruption of a hazardous neighboring site.

Natural Hazard: Incidents which are not human-caused including earthquakes, floods, hurricanes, tornadoes, and wildfires.

Owner Indicator: An estimate of the financial losses to the owner of the asset or system for each threat-asset pair. This includes repair and replacement of any damaged or destroyed assets, business interruption costs, penalties for service interruption or environmental impacts, and any other costs directly related to the attack.

Path Analysis: The analysis of the physical paths that adversaries can follow to accomplish their objective.

Preparedness: A continuous cycle of planning, organizing, training, equipping, exercising, evaluating, and taking corrective action in an effort to ensure effective coordination during the incident response and recovery, including continuity of operations plans, continuity of government plans, and preparation of resources for rapid restoration of function.

Prioritization Level: The level of importance chosen by the analysis team for either an individual asset or a threat-asset pair, which is scored on a 1-5 scale.

Probability: A measure of the likelihood, degree of belief, frequency, or chance that a particular event will occur in a period of time (usually one year) or number of iteration or trials. This is usually expressed quantitatively as a value between 0 and 1, a range of values between 0 and 1, a distribution (density function), or the mean of such a distribution. Probability can also be expressed in qualitative terms, e.g. low, moderate, or high, if there is a common understanding of the meaning of the qualitative terms.

Proximity Hazard: A threat that arises from being near another facility that is or could be hazardous.

Proxy Indicator: Estimates the likelihood of malevolent attacks based on the adversary's objectives and capabilities and the attractiveness of the facility relative to alternative targets.

Reference Threat: A particular attack specified in terms of intensity or magnitude, mode, and medium of delivery, to be used in a consistent fashion across numerous assets to facilitate direct comparisons. It is not to be confused with "design basis threat", which is the type and intensity of threat a facility is designed to withstand.

Regional Indicator: An estimate of the financial losses to the community, suppliers, and customers. This is dependent on the length of time and the extent of which the service is disrupted. Customers may include other utilities and the destruction of an asset may cause other utilities to become unavailable to customers.

Resilience: The ability of an asset or system to withstand an attack or natural hazard without interruption of performing the asset or system's function or, if the function is interrupted, to restore the function rapidly.

Risk: A function of consequences, hazard frequency or likelihood, and vulnerability, which with point estimates, is the product of the terms. It is the expected value of the consequences of an initiating event weighted by the likelihood of the event's occurrence and the likelihood that the event will result in the consequences, given that it occurs. Risk is based on identified events or event scenarios.

Risk Analysis: The technical and scientific process of estimating the components of risk and combining them into the estimate of risk. Risk analysis provides the processes for identifying threats, hazards or hazard scenarios, event probability estimation, vulnerability assessment, and consequence estimation.

Risk Management: The deliberate, cyclical process of understanding risk based on a risk analysis and deciding upon, implementing and managing action, e.g., security countermeasures or consequence mitigation features, to achieve an acceptable level of risk at an acceptable cost. Risk management is characterized by identifying, measuring, estimating, and controlling risks to a level commensurate with an assigned or accepted value, monitoring and evaluating the effectiveness of implementation and operation of the selected options (with corrective action as needed) and periodic repetition of the full risk management cycle.

Scenario: A combination of events and system states that lead to an undesired event. A scenario defines a suite of circumstances of interest in a risk assessment. In the present context, a scenario includes at least a specific threat (man-made or natural hazard) to a specific asset, with the associated probabilities and consequences.

Statistical Value of Life: The monetary value placed on eliminating the risk of one premature death.

Statistical Value of Minor Injury: The monetary value placed on eliminating the risk of an individual being injured to an extent that the injuries do not affect the person's ability to continue a normal life.

Statistical Value of Serious Injury: The monetary value placed on eliminating the risk of an individual being injured to an extent that they are unable to continue living a normal life.

System: A group of interacting, interrelated, or interdependent elements, such as people, property, materials, environment, and/or processes, for a single purpose or defined set of purposes. The elements together form a complex whole that can be a physical structure, process, or procedure of some attributes of interest.

Threat: A man-made or natural event with the potential to cause harm. In malevolent risk analysis, threat is based on the analysis of the intention and capability of an adversary (whether insider or outsider) to undertake actions that would be detrimental to an asset. Threats may also arise from natural hazards or dependency hazards (interruptions of supply chains or proximity to dangerous or hazardous sites.

Threat-Asset Pair: The combination of a single threat and a single asset within the system for the purpose of analyzing the risk and resilience for each pair.

Threat Likelihood: The probability that an undesirable event will occur. With natural hazards, the threat likelihood is the historical frequency of similar events unless there is a belief that the future will differ from the past. With malevolent threats, the likelihood is a function of available intelligence, the objectives and capabilities of the adversary, and the attractiveness, symbolic, or fear-inducing value of the asset as a target.

Utility Resilience Index: An assessment of a utility's ability to absorb and/or cope with an incident and return to normal operations as quickly as possible. The URI is comprised of an Operational Resilience Index and a Financial Resilience Index.

Vulnerability: An inherent state of a system (e.g., physical, technical, organizational, cultural) that can be exploited by an adversary or impacted by a natural hazard to cause harm or damage. Such weaknesses can occur in building characteristics, equipment properties, personnel behavior, locations of people, equipment, and buildings, or operational and personnel practices. Vulnerability is expressed as the likelihood of an event's having the estimated consequences, given that the event occurs.

Vulnerability Assessment/ Vulnerability Analysis: A systematic examination of the ability of an asset to withstand a specific threat or undesired event, including current security and emergency preparedness procedures and controls. A vulnerability assessment often suggests countermeasures, mitigation measures, and other security improvements.

Vulnerability Estimate: The probability, given the incident occurs, that an attack or natural event will cause specifically estimated consequences.

Worst Reasonable Case: An operating assumption for estimating consequence values that utilizes the most severe but reasonable and credible consequences for a specific hazard but does not combine unlikely coincidences. In an adversarial event, it directly reflects the assumption that an adversary is knowledgeable about the asset do be attacked and adaptive given emergent conditions.