
PARRE™
Program to Assist in Risk and Resilience Examination
J100-21
User's Guide 3.1
As a result of the attacks of September 11, 2001, a new focus on securing the Nation's infrastructure
brought about development of new risk analysis strategies and programs. In 2009, the water-sector standard,
AWWA/ANSI J100-10 Risk and Resilience Management of Water and Wastewater Systems was published. This standard is
different than other types of risk analysis due to the fact that it includes a "resilience" component.
This J100 approach to risk and resilience analysis is time consuming and calculation intensive.
As a result, Applied Engineering Management Corporation (AEM) took on the task of developing a program to
assist you in completing a thorough and complete analysis of your system. By using PARRE™, your team
will be able to complete the analysis in a timely manner and can be confident that your work will be
compliant with America's Water Infrastructure Act of 2018 (AWIA) regulations.
This document is intended to assist you in using PARRE™. Step by step instructions will walk you through
each step and ensure compliance with the J100-21. Please note that this document is to be used in conjunction
with the J100-21 standard and is not intended to replace it.
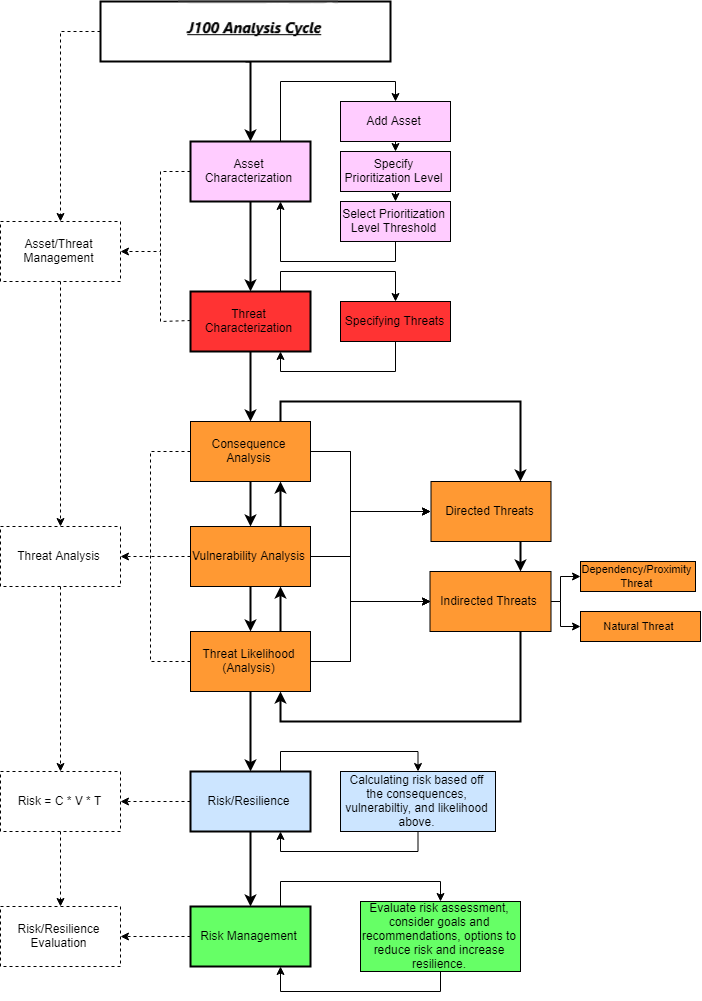 RAMCAP 7-Step Analysis Process
This is the first step in the RAMCAP process and it is important to include all necessary information to
accurately move forward in your analysis. This page is used to define all of
your assets, decide which ones are critical to the operation of
your system, and give prioritization levels for each.
To go back to the main projects page, click Projects.
To go to the Threat Characterization page without going back to the home screen,
click Threats.
To go to the threat-asset matrix, click Threat-Asset Matrix.
To add an asset to your system, click the New Asset  box in the upper left. A pop-up window will appear, and
you will be directed to input the requested information pertaining to your asset, as displayed in the following figure.
All required data boxes are marked with a red asterisk—
the asset won't save if they are not filled in.
box in the upper left. A pop-up window will appear, and
you will be directed to input the requested information pertaining to your asset, as displayed in the following figure.
All required data boxes are marked with a red asterisk—
the asset won't save if they are not filled in.
Adding an Asset
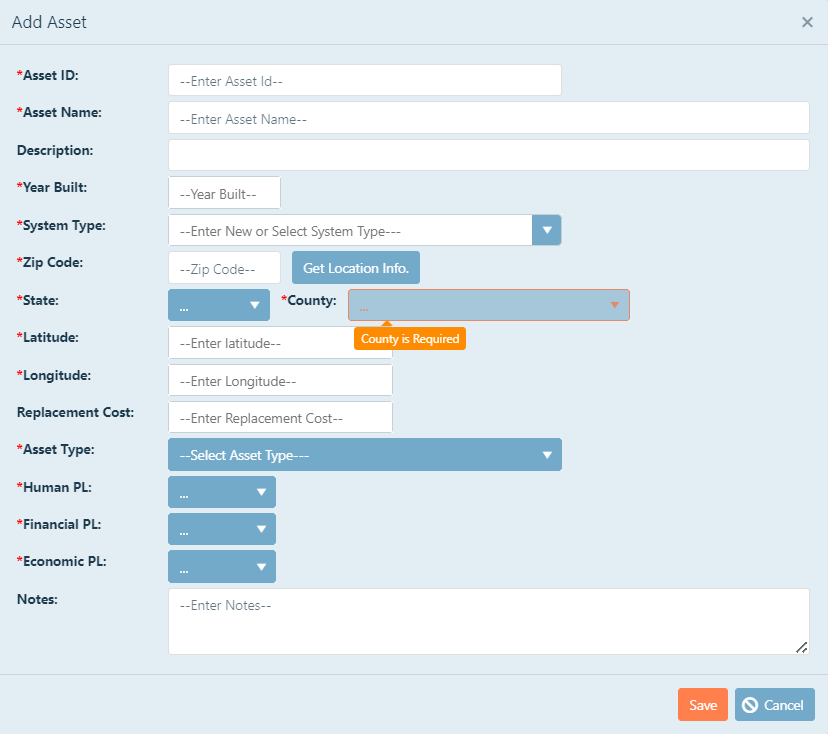
Asset ID: This can be an ID that you chose for this analysis, or can be an ID number that is contained in your asset
management system. To enter an ID, click in the text box, and then type the ID.
Asset Name: The name should be distinguishable from other assets in the assessment. Example: 20th Street Pump Station.
To enter a name, click in the text box, and then type the name.
Description: You can add additional information about the asset here, but is not required. To add additional descriptions,
click in the text box, and then type the description.
Year Built: This is the year the asset was built. If there has been a major rehab or rebuild since that time, enter the
year of the major rehab or rebuild. This is intended to identify the building code associated with the asset
when a threat, specifically a natural threat, occurs. To enter a year, click in the text box, and then enter the four-digit year.
System type: System type allows you to group the assets. General groupings may be tanks, pumps, distribution, treatment
processes, etc. You must add your own system types; however, once you add one, it will be saved as an option for future assets
and you will see it listed as availible to use.
To add a system type, click in the text box, and enter the type. To select an already used type,
click the pull-down next to the box, and choose an existing type. If you try and select a system type before adding one, you will get the following screen:
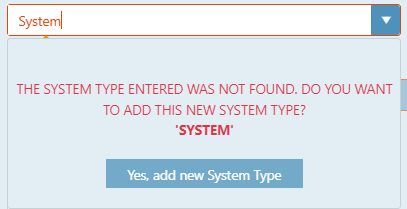
Simply type in the Enter New or Select System Type box and click "Yes, add new System Type".
Zip Code: Enter the zip code for the asset. To enter the zip code, click in the box, and then type the five-digit zip code.
Latitude/Longitude: Entering a valid zip code will allow for the program to find the centroid latitude and longitude of that zip code. Once the zip code is entered, click
the Get Location Info.  box, and the state, county, latitude, and longitude cells will populate with
the specific coordinates for that zip code. You may also enter in the exact coordinates of the asset yourself.
box, and the state, county, latitude, and longitude cells will populate with
the specific coordinates for that zip code. You may also enter in the exact coordinates of the asset yourself.
Replacement Cost: The replacement cost for the asset is the dollar amount that would have to be invested, in today's dollars, to fully replace the asset. To enter
the replacement cost, click in the text box, and then enter the cost in dollars. You do not need to add the dollar $ symbol, it will add it once you are done typing in the box.
Asset Type: The asset type helps to identify the ability of an asset to withstand an attack, namely natural hazards. It helps to differentiate between
potential damage to a weaker asset, like a trailer, and a stronger asset, like a pump. To select an asset type, click on the drop-down menu, and
then choose the asset type.
The final step in adding an asset is prescribing prioritization values to each of the asset's impact on human, financial, and economical categories. To review an explanation of prioritization values,
see Adding Prioritization Levels.
Notes: Add any notes to your asset for your own reference.
Each asset must have prioritization levels assigned to it. However, you are able to decide which ones are
critical enough to be included in the analysis (see Selecting a Prioritization Level Threshold).
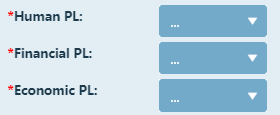
There are 3 categories of prioritization, which are described below:
-
Human PL - describes the severity of the human loss or injuries if that asset is attacked.
-
Financial PL - describes the amount of money that the owner would have to spend to repair or
replace that asset if it was attacked.
-
Economic PL - describes the effect on the
surrounding community if you were unable to provide service due to an attack on that asset.
You can give each asset a score from 1 to 5 on each of these factors:
- Very Low Priority
- Low Priority
- Moderate Priority
- High Priority
- Very High Priority
In the Add Asset or Edit Asset pop-up window, choose the appropriate value from each pull down menu
that describes the priority level you have decided upon.
Click Save once all choices have been made or click Cancel to discard the asset.
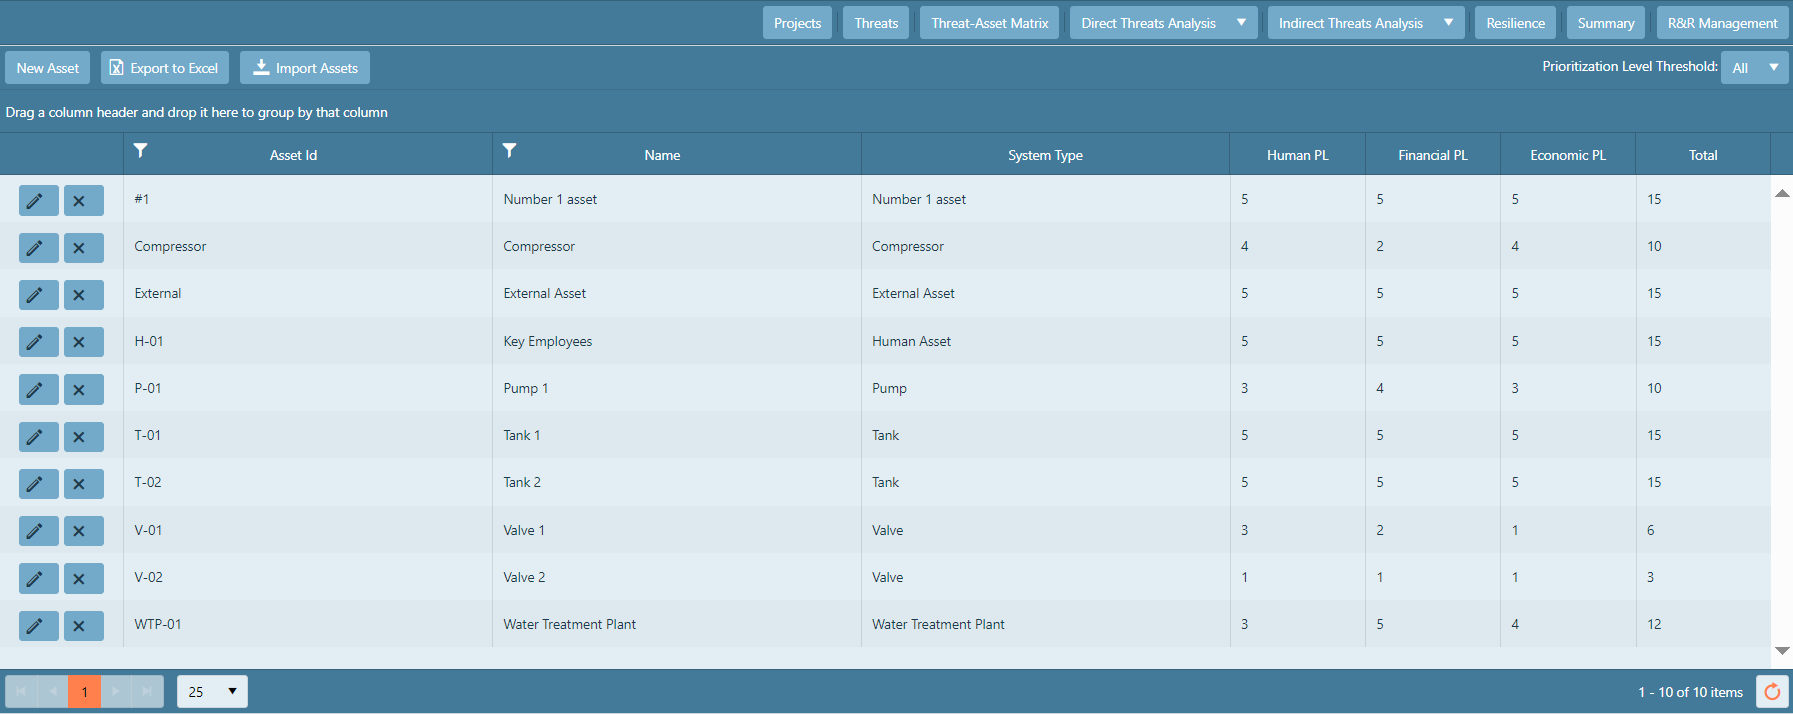
Once you have added all of your assets and assigned prioritization levels, you must decide which assets
you will move forward with. The last column on the assets page is the prioritization level Total.
This total is the sum of the human, financial, and economic prioritization levels and will range from
3 to 15.
The Prioritization Level Threshold  (upper right of page) is the minimum prioritization level total that will be assessed against threats.
Click the drop-down box, then choose the number that you see fit to be the minimum total. Any asset with
a total PL below this number will not be used further in the program, and will not be visible on the assets page. This action does not delete your asset. To view all assets regardless of prioritization level total, click All in the Prioritization Level Threshold scroll-down.
(upper right of page) is the minimum prioritization level total that will be assessed against threats.
Click the drop-down box, then choose the number that you see fit to be the minimum total. Any asset with
a total PL below this number will not be used further in the program, and will not be visible on the assets page. This action does not delete your asset. To view all assets regardless of prioritization level total, click All in the Prioritization Level Threshold scroll-down.
To delete an asset that you have added, click on delete icon  to the left of the asset row.
To edit an asset that has already been saved, click edit icon  to the left of the asset row.
The threats that exist against every asset in your
system are predefined by the J100 standard.
This section is the second step in the J100 process which helps you to
identify which threats are applicable to your system to be further assessed.
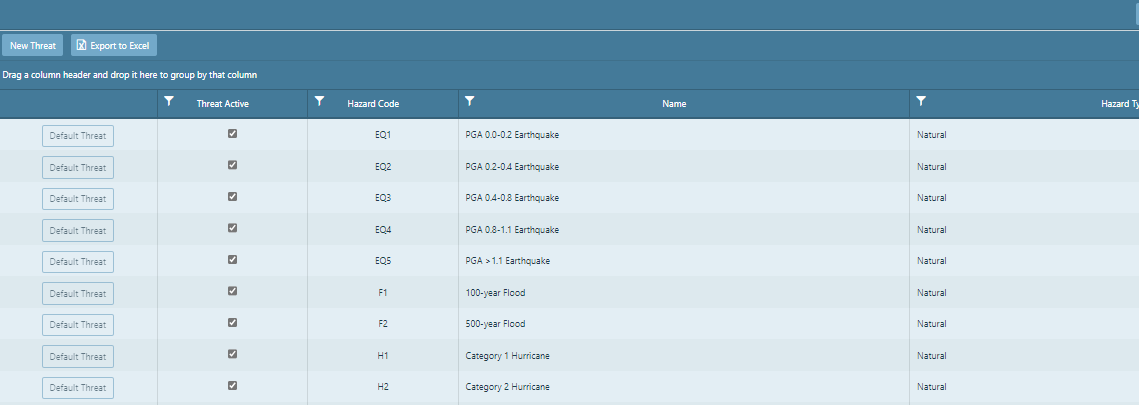
The J100 standard requires that all threats are accounted for unless there is sufficient justification that a threat
will not occur. All of the threats are checked by default. You should not uncheck any of the boxes
without including proper justification, e.g. a facility located in the State of Utah would not be affected
by a hurricane of any type. Each scenario is predetermined and cannot be altered.
The process for adding threats is the same as the process for assets. However, you will only need to add a threat
if you determine an unprescribed threat that is important. Before you add a threat, review the predetermined threats
to ensure you are not adding one already present (see Threat Description).
It is optional to add threats outside the ones predetermined by the J100 standard. If there are
other threats that you have determined are important, you may add them to the analysis.
To add a threat to your system, click the New Threat box
in the upper left. A pop-up window will appear, and you will be directed to input the requested information pertaining to your threat,
as displayed in the following figure. All required data boxes are marked with a red asterisk — the threat won't save if they are not
filled in.
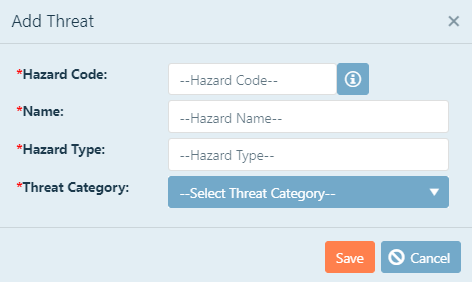
Hazard Code: This is a Hazard Code that you choose for the new threat. To enter a Hazard Code, click in the text box,
and then type the Code.
Name: This is a unique name that characterizes the threat (e.g. Hurricane, Tornado, Hail, etc.).
Hazard Type: Enter the type of hazard. Be sure to follow the same formatting as the other existing threats (e.g. Natural).
Threat Category: Select a threat category from the drop-down menu. If you choose Man-made Hazard from this drop-down, you will
have to enter a detection likelihood.
The detection likelihood is the probability that authorities will be
notified of the potential attack before the attacker has a chance to carry it out.
Each of the existing man-made
threats have pre-determined likelihoods outlined in the AWWA J100-21 Standard in Table F-2 on page 67, which are pre-programmed into PARRE™.
The value must be between 0.0 and 1.0. To enter the likelihood, click in the text box, and then enter the value.
Clicking the Save box will save and close
the Add Threat window.
Clicking the Cancel box will close the window without saving the new threat.
The J100 standard requires that all threats are accounted for unless there is sufficient justification that a threat
will not occur. All of the threats are checked by default. You should not uncheck any of the boxes
without including proper justification, e.g. a facility located in the State of Utah would not be affected
by a hurricane of any type. Each scenario is predetermined and cannot be altered.
To deselect a threat, click on the check-box under the Threat Active column on the main threats page,
in the same row as the given threat. An Add Note box will appear for you to provide justification for not analyzing that particular threat.
You must give justification in order to remain J100 compliant.
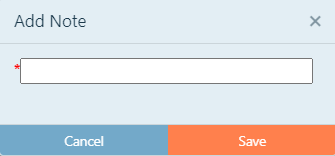
Click Save to save your reasoning. Your justification will appear below the unchecked box and
that threat will not appear in the remainder of the analysis.
To select a threat that was previously deselected, click the check-box under Threat Active.
The threat will reactivate and the justification text will no longer be shown.
When a new threat is created, two boxes will appear to the left of the new threat.
To edit a threat that you added, click the edit threat
icon .
The Edit Threat window will appear for you to edit your threat. Click the orange Update box to save your edits, or click
cancel to discard updates. You may not edit any of the predetermined threats.
To delete a threat that you added, select the threat that you want to delete, and then click the delete
threat icon . The threat and all of the accompanying information will no longer appear.
This section shows all of the threats that can be analyzed. These include
natural hazards, dependency and
proximity hazards, and malevolent or man-made threats. The scenarios
are explained here to assist you in making a decision regarding their inclusion in the analysis.
Natural Hazards fall into six categories in this analysis:
hurricanes, earthquakes, tornadoes, floods, wildfires, and ice storms. As defined in the J100 standard, they are:
-
H - Hurricanes:
-
H1 - Category 1: Hurricane with sustained winds of 74-95 mph; limited damage to structures; flooding near coasts; some trees are uprooted and snapped; widespread power loss
likely for up to several days [Ex: Irene (1999)]
-
H2 - Category 2: Hurricane with sustained winds of 96-110 mph; some damage to roofing material; mobile homes damaged;
flooding near coasts; many trees are uprooted and snapped; near-total power loss
likely for up to several days [Ex: Bonnie (1998)]
-
H3 - Category 3: Hurricane with sustained winds of 111-129 mph; structural damage to small buildings; mobile homes destroyed; gable-end roofs are
peeled off; coastal flooding; large number of trees uprooted and snapped; near-total power loss
likely up to several weeks [Ex: Keith (2000)]
-
H4 - Category 4: Hurricane with sustained winds of 130-156 mph; extensive structural damage to most buildings/structural failure on small buildings;
flooding inland and near coasts; most trees are uprooted or snapped; total power loss likely for up to several weeks [Ex: Hugo (1989)]
-
H5 - Category 5: Hurricane with sustained winds of >157 mph; roof failure and structural damage to most buildings; few structures survive intact;
major flooding inland and coastal; virtually all trees are uprooted or snapped; power loss up to several months [Ex: Katrina (2005)]
-
EQ - Earthquakes:
- EQ1 - PGA 0.0-0.2: Earthquake with weak to light shaking, causing minimum structural damage
-
EQ2 - PGA 0.2-0.4: Earthquake with moderate to strong shaking, causing light to moderate damage, particularly to poorly built or badly
designed structures
- EQ3 - PGA 0.4-0.8: Earthquake with very strong to severe shaking, causing moderate to heavy damage to integrity of masonry and frame structures
-
EQ4 - PGA 0.8-1.1: Earthquake with violent shaking, causing heavy damage, partial building collapses, and potentially shifting structures
off foundations; some underground pipes are broken
-
EQ5 - PGA >1.1: Earthquake with extreme shaking, causing very heavy damage to masonry, frame structures, foundations, dams, and bridges; considerable
damage to underground pipelines; large landslides may occur
-
T - Tornadoes:
-
T0 - EF0 : Tornado with estimated winds 65-85 mph; limited damage - some damage to chimneys; branches broken off trees; shallow-rooted trees published
over; sign boards damaged
-
T1 - EF1: Tornado with estimated winds 86-110 mph, moderate damage - peels surface off roofs; mobile homes pushed off foundations or overturned;
moving autos pushed off the roads; attached garages may be destroyed
-
T2 - EF2: Tornado with estimated winds 111-135 mph; significant damage - roofs torn off frame houses; mobile homes demolished; boxcars overturned;
large trees snapped or uprooted; high-rise windows broken and blown in; light-object missiles generated
-
T3 - EF3: Tornado with estimated winds 136-165 mph; severe damage - roofs and some walls torn off well-constructed houses; trains overturned;
most trees in forest uprooted; heavy cars lifted off the ground and thrown
-
T4 - EF4: Tornado with estimated winds 166-200 mph; devastating damage - well-constructed houses leveled; structures with weak foundations blown away
some distance, cars thrown and large missiles generated
-
T5 - EF5: Tornado with estimated winds >200 mph; incredible (total) damage - strong frame houses lifted off foundations and carried considerable distances
to disinegrate; automobile sized missilies; trees debarked; steel reinforced concrete structures badly damaged
-
F - Floods:
- F1 - 100-year Flood : Flood events that have a 1% chance of occuring in a given year based on historical events
- F2 - 500-year Flood: Flood events that have a .2% chance of occuring in a given year based on historical events
-
W - Wildfires:
- W1 - Minor : Wildfire that has consumed an area between 0.01 and 10 km^2
- W2 - Major : Wildfire that has consumed an area greater than 10 km^2
-
I - Ice Storms:
- I1 - 3 Hour Outage Ice Storm : Some isolated of localized utility outages possible, typically lasting only a few hours. Roads/bridges may become slick and hazardous. Some tree limb damage
- I2 - 1 Day Outage Ice Storm : Numerous utility interruptions expected, typically lasting 24 to 72 hours. Roads/travel conditions may be extremely hazardous. Moderate tree damage expected
- I3 - 5 Day Outage Ice Storm : Widespread utility outages with damage to main feeder lines and equipment expected. Tree limb damage is excessive. Outages may last from 3 to 5 days
- I4 - 10 Day Outage Ice Storm : Prolonged and widespread utility interruptions and extensive damage to main distribution feeder lines and some high voltage transmission lines/structures. Outages lasting 5 to 10 days
- I5 - 21 Day Outage Ice Storm : Catastrophic damage to entire exposed utility systems, including both distribution and transmission networks. Outages could last several weeks in some areas. Shelters needed.
Dependency and Proximity hazards
are threats that occur outside the facility that could affect the facility and its operation. These
threats include attacks on supplies, employees, and customers that are important to keep the facility
running. It also includes attacks on a nearby facility that can damage the facility being analyzed.
As defined in the J100 standard they are:
-
D(E) - Key Employees: Employees are unable / unwilling to come to work for the number of days
set as the employee resilience standard.
-
D(U) - Utilities: Unable to provide service for the number of days set as the
organizational resilience standard. (e.g. the electric company cannot supply electricity to the
water treatment plant, therefore the treatment plant cannot supply water to its customers).
-
D(S) - Key Suppliers: Service interruption for the number of days set as the supplier
resilience standard. (e.g. supplier of chlorine for treatment closes and is unable to deliver).
-
D(C) - Key Customers: Unable to take production for the number of days set as the customer
resilience standard. (e.g. damage is so severe that customers leave their homes/businesses or a large
customer that the facility depends on monetarily no longer needs the services of the facility).
-
D(T) - Transportation: Facilities into and/or out of the site are inoperable for the number
of days set as the transportation resilience standard. (e.g. employees/supplies are unable to reach
the facility)
-
D(P) - Proximity: Near others' assets that, if damaged by human or natural causes, would impair function or mission of the asset being assessed.
The intent of product contamination is to cause harm by introducing an undesired contaminant to the
system that would cause harm to customers or to the system.
- C(C) - Chemical: Contamination of the product with a chemical.
- C(R) - Radionuclide: Contamination of the product with a radionuclide.
- C(B) - Biotoxin: Contamination of the product with a biotoxin.
- C(P) - Pathogenic: Contamination of the product with a microbial pathogen.
- C(S) - Explosive: "Weaponization" of the product.
In all of these threats, the intent is to cause harm by damaging, disabling, or destroying process
control systems. The two ways an attack of this type can be accomplished are:
- S(PI) - Physical Insider: Insider causing harm by physically damaging, disabling, or destroying process control systems.
- S(PU) - Physical Outsider: Outsider using unauthorized access to cause harm by damaging, disabling, or destroying process control systems.
In all of these threats, the intent is to steal or divert information, dangerous substances, valuable
resources, etc. The two ways an attack of this type can be accomplished are:
- T(PI) - Physical Insider: Insider stealing or diverting information, dangerous substances, or other valuable resources.
- T(PU) - Physical Outsider: Outsider using unauthorized access to steal or divert information, dangerous substances, or other valuable resources.
An attack by a maritime vessel is only possible if your facility or critical assets to your
facility are located in/directly next to a body of water. This type of attack assumes that
the boat is carrying explosives and the boat itself strikes your asset. There are four different
categories of a marine attack.
-
(M1) - Marine Threat - Small Boat: Less than a 10 ft draft carrying an explosive charge
of 400 lbs (TNT equivalent).
-
(M2) - Marine Threat - Fast Boat: Less than a 10 ft draft carrying an explosive charge of 2,000 lbs
(TNT equivalent).
- (M3) - Marine Threat - Barge: Carrying an explosive charge of 20,000 lbs (TNT equivalent).
-
(M4) - Marine Threat - Deep Draft: Carrying an explosive charge greater than 20,000 lbs
(TNT equivalent).
An attack by an aircraft assumes that the aircraft would be used as the weapon and would strike your
asset directly.
-
(A1) - Air Attack - Helicopter: Fuel capacity of 184 gallons and a maximum air speed of 117 mph. It
would be carrying 800 lbs of explosives (TNT equivalent).
-
(A2) - Air Attack - Small Plane: Fuel capacity of 56 gallons and a maximum air speed of 123 mph. It
would be carrying 800 lbs of explosives (TNT equivalent).
-
(A3) - Air Attack - Medium Sized Regional Jet: Weighs 12,500 lbs with a fuel capacity of 1,200 gallons
and a maximum air speed of 465 mph.
-
(A4) - Air Attack - Long-Flight Jet: Weighs 450,000 lbs with a fuel capacity of 12,000 gallons and a
maximum air speed of 530 mph.
An automotive attack assumes that the vehicle would be used as a weapon and would strike your asset
directly. These threat scenarios do not include assault teams, only single VBIED (Vehicle Based
Improvised Explosive Device).
- (V1) - Car Bomb: Carries 400 lbs of explosives (TNT equivalent).
- (V2) - Van Bomb: Carries 4,000 lbs of explosives (TNT equivalent).
- (V3) - Mid-Size Truck Bomb: Carries 10,000 lbs of explosives (TNT equivalent).
- (V4) - Large Truck Bomb (18 Wheeler): Carries 40,000 lbs of explosives (TNT equivalent).
The assault team attack is more complex. It involves a lone assailant or a team of assailants with
specific types of weapons and various options for an approach.
-
(AT1) - 1 Assailant: Arriving on land either by foot, all-terrain vehicle, motorcycle, over
the road personnel transport, or cargo truck by water as a lone swimmer. The assailant will
be carrying a pistol, assault rifle, or light machine gun. The explosives that the assailant
would be carrying would include grenades (H.E. and incendiary) or an explosive vest or satchel
with 65 lbs of explosives. Minimal breaching tools, hand tools, and power tools would also be in the assailant's possession.
-
(AT2) - 2-4 Assailants: Arriving by all-terrain vehicles, motorcycles, over the road
personnel transport, or cargo truck by land; in 1 helicopter with a pilot and a 1-3 person attack
force by air; or in a small boat (Zodiac). They would be carrying pistols, assault rifles,
sniper rifles (.50 caliber), and light machine guns. They would be able to carry 65 lbs of
explosives per person in the forms of grenades (H.E. and incendiary), bulk explosives, and
VBIED (400-lb TNT equivalent) for access or attack. They would also have mechanical breaching
tools and required hand tools.
-
(AT3) - 5-8 Assailants: Arriving by all-terrain vehicles, motorcycles, over the road
personnel transport, or cargo truck by land; 2 helicopters with 2 pilots and a 4-6 person
attack force by air; or in 1 small boat (Zodiac or personnel) and 1 small/medium cargo
watercraft for equipment. They would be carrying pistols, submachine guns, assault rifles,
sniper rifles (.50 caliber), light machine guns, and rocket propelled grenades (RPG).
They would be able to carry 65 lbs of explosives per person in the forms of grenades (H.E. and
incendiary), bulk explosives, VBIED (400-lb TNT equivalent) for access or attack, and specialized
explosive charges (breaching charges, shape charges, ballistic discs). They would also have
mechanical breaching tools, quick saws, chainsaws, sledge hammers, and required hand tools.
-
(AT4) - 9-16 Assailants: Arriving by all-terrain vehicles, motorcycles, over the road
personnel transport, or cargo truck by land; 3 helicopters with 3 pilots and a 7-13 person attack
force by air; or in 2 small boats (Zodiac) and 1 medium cargo watercraft for equipment. They
would be carrying pistols, submachine guns, assault rifles, sniper rifles (.50 caliber), light
machine guns, and rocket propelled grenades (RPG). They would be able to carry 65 lbs of
explosives per person in the forms of grenades (H.E. and incendiary), bulk explosives, 2 VBIEDs
(400-lb TNT equivalent) for access or attack, specialized explosive charges (breaching charges,
shape charges, ballistic discs), and antipersonnel mines. They would also have mechanical
breaching tools, quick saws, chainsaws, sledge hammers, and required hand tools.
Unauthorized access through cyber intrusion to cause harm by damaging, disabling, or destroying process control systems.
-
(C1) - Cyber Attack: Sabotaging information technology equipment by damaging, disabling, or destroying process control systems.
The threat-asset matrix page allows you to prioritize your threat-asset pairs. Each asset that lies at or above your asset
threshold that was entered on the asset characterization page will be shown in the first column by the
asset ID and name. The threats that you chose to include in your analysis will be listed across the top of the
sheet by the hazard code. Each cell in the matrix is related to an asset and a threat. The value of the cell is the level of concern you have placed on
that threat hitting that asset. Fill out the prioritization matrix for each asset by clicking in each box. The values are:
- Very Low
- Low
- Moderate
- High
- Very High
To save the your values entered into the matrix, click the Save changes box above Asset ID.
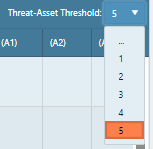
The Threat-Asset Threshold scroll-down is the value which you deem to be the lowest priority level that should be included in
your analysis. The program will color any value box that is at or above your chosen value yellow. Those
threat-asset pairs will move forward in the analysis.
The Threat Count number shows the number of threats shown in the matrix. They are only the threats that remain active
from the Threat Characterization Page.
The Asset Count number shows the number of assets shown in the matrix. They are only the assets above the asset
threshold you selected on the Asset Characterization page.
The Threat-Asset T/A Threshold Count shows you the number of threat-asset pairs that are at or above your selected Threat
Asset Threshold. This is the number of threat-asset pairs that will move forward in the analysis and will
have consequence, vulnerability, and threat values calculated.
This page evaluates the potential worst reasonable consequences of a malevolent attack on your
critical assets. The consequences you will be analyzing are fatalities, serious injuries, duration in days, severity, and financial impact on the owner.
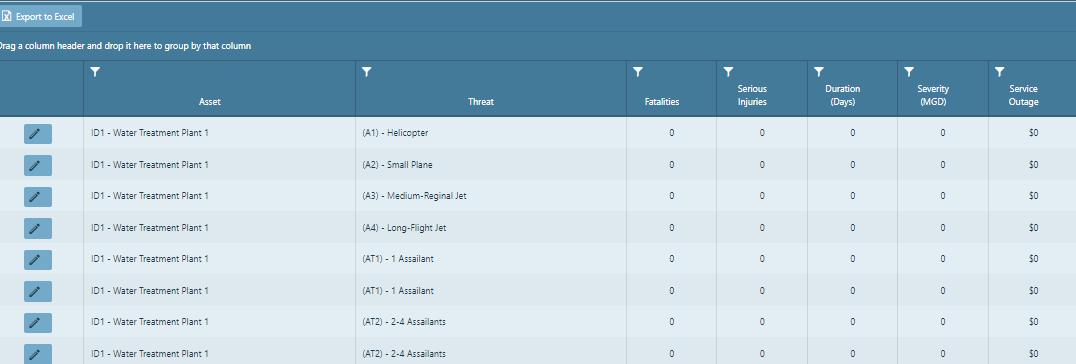
To add consequence information to an asset, click the edit box to the left of an asset.
A pop-up window will appear and you will be able to edit the appropriate information.
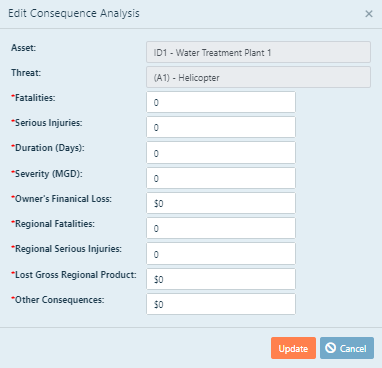
Asset/Threat: You will not be able to edit Asset and Threat information in this window. It is only displayed for reference.
Fatalities: NOTE: If you elected to not include a statistical value of life
and a statistical value of serious injury
on the start-up page, this section will still appear on the page but will not be calculated into the
final risk number. The statistical value of life is needed to calculate the potential impact of
fatalities on your system on a monetary level.
The number of fatalities that are expressed here is the estimated number of persons,
both employees and non-employees, on site, who are fatally injured or sickened due the threat-asset event
and die immediately or within 30 days of the event.
To change the number of fatalities associated with a threat-asset pair, click inside the first
editable box, and then type the number of expected fatalities from this attack.
Serious Injuries: NOTE: If you elected to not include a
statistical value of life
and a statistical value of serious injury on the
start-up page, this section will still appear on the page but will not be calculated
into the final risk number. The statistical value of serious injury is needed to calculate the
potential impact of serious injuries on your system on a monetary level.
The number of serious injuries that are expressed here is the estimated number of persons, both employees and non-employees, on site,
who are seriously injured or sickened due the threat-asset event within 30 days.
To change the number of serious injuries associated with a threat-asset pair, click inside the second
editable box, and then type the number of expected serious injuries from this attack.
Duration and Severity: The duration and severity of the consequences give
values to the length of time that the asset will be out of
service and the amount of water that will not be delivered per day. The duration is defined as the number of days that
the asset is out of service while waiting for repair or replacement. The severity is the number of million gallons per day (MGD)
that will not be delivered to customers, given that the asset is not functioning. These values are used to calculate operational
losses and will be included in the "Financial Total" column.
To change the duration that the asset will be non-functional, click inside the editable box labelled
"Duration (Days), and then type the number of expected days the asset will be down.
To change the severity of the loss of the asset, in MGD, click inside the editable box, and then type
the number of MGD lost through that asset.
Owner's Financial Loss: The owner's impact of an attack is an estimate of the
financial losses to the owner of the asset
or system for each threat-asset pair. This includes repair and replacement of any damaged or
destroyed assets, business interruption costs, penalties for service interruption or environmental
impacts, and any other costs directly related to the attack. This is also known as the Owner Indicator
and the value is expressed in dollars.
To change the Owner's Financial Loss associated with a threat-asset pair, click inside the
next editable box, and then type the financial impact, in dollars, to the owner from this attack.
Regional Fatalities: Estimate regional fatalities is the estimated number of non-employees, off site,
who are fatally injured or sickened due the threat-asset event and die immediately or within 30 days of the event.
To change the Regional Fatalities associated with a threat-asset pair, click inside the
next editable box, and then type the number of regional fatalities resulting from this attack.
Regional Serious Injuries: The estimated number of non-employees, off site,
who are seriously injured or sickened due the threat-asset event within 30 days.
To change the Regional Serious Injuries associated with a threat-asset pair, click inside the
next editable box, and then type the number of regional serious injuries resulting from this attack.
Lost Gross Regional Product: The community's impact of an attack on an asset
is the monetary impact on the community or general public and
is dependent on that length of time which the service in interrupted. This is also known as the Regional
Indicator. This includes suppliers, customers, and anyone in the area of the assets' location that could
be affected by an attack. Economic losses due to a disruption of service or physical damage should be
included here. This value is expressed in dollars.
To change the community's economic impact associated with a threat-asset pair, click
inside the last editable box, and then type the economic impact, in millions of dollars,
to the served community from this attack.
Other Consequences: The estimated = capital lost due to the threat associated with this asset that is not included in the
other categories.
To change the Other Consquences associated with a threat-asset pair, click
inside the last editable box, and then type the economic impact, in millions of dollars,
to the served community from this attack.
When you have finished making your changes, click Update.
To cancel your changes and exit the edit box without saving, click Cancel.
The financial total column calculates the total financial impact including Owners financial impact,
the calculated losses from the severity, duration, and commodity rate, and the monetary values of the losses of life
and serious injuries (if applicable) to determine the financial total.
The vulnerability analysis of directed or malevolent threats determines the probability that a threat,
given that it occurs, will overcome the countermeasures you have put into place and cause the damages
you found in the consequence analysis. This section allows you to add a specific analysis to any given asset and also add
any existing countermeasures against an attack on your system.
To navigate to the vulnerability page, click the drop down menu for Direct Threats Analysis and select the Vulnerability tab.
There are three (3) methods that are available for determining the vulnerability of your assets to malevolent attacks:
-
Path analysis — Path analysis breaks down the relationship between the amount of time it will take
a threat to gain access to your asset and the amount of time it takes for a response team to stop the attack.
-
Expert Judgement — Direct expert judgement does not require any mathematical calculations or analyses
to be entered into the PARRE™ program, but it is necessary to involve experts that are familiar with your assets
as well as the threats that could affect them.
- Event Tree — Uses the probabilities of success and failure rates of a threat attacking your assets.
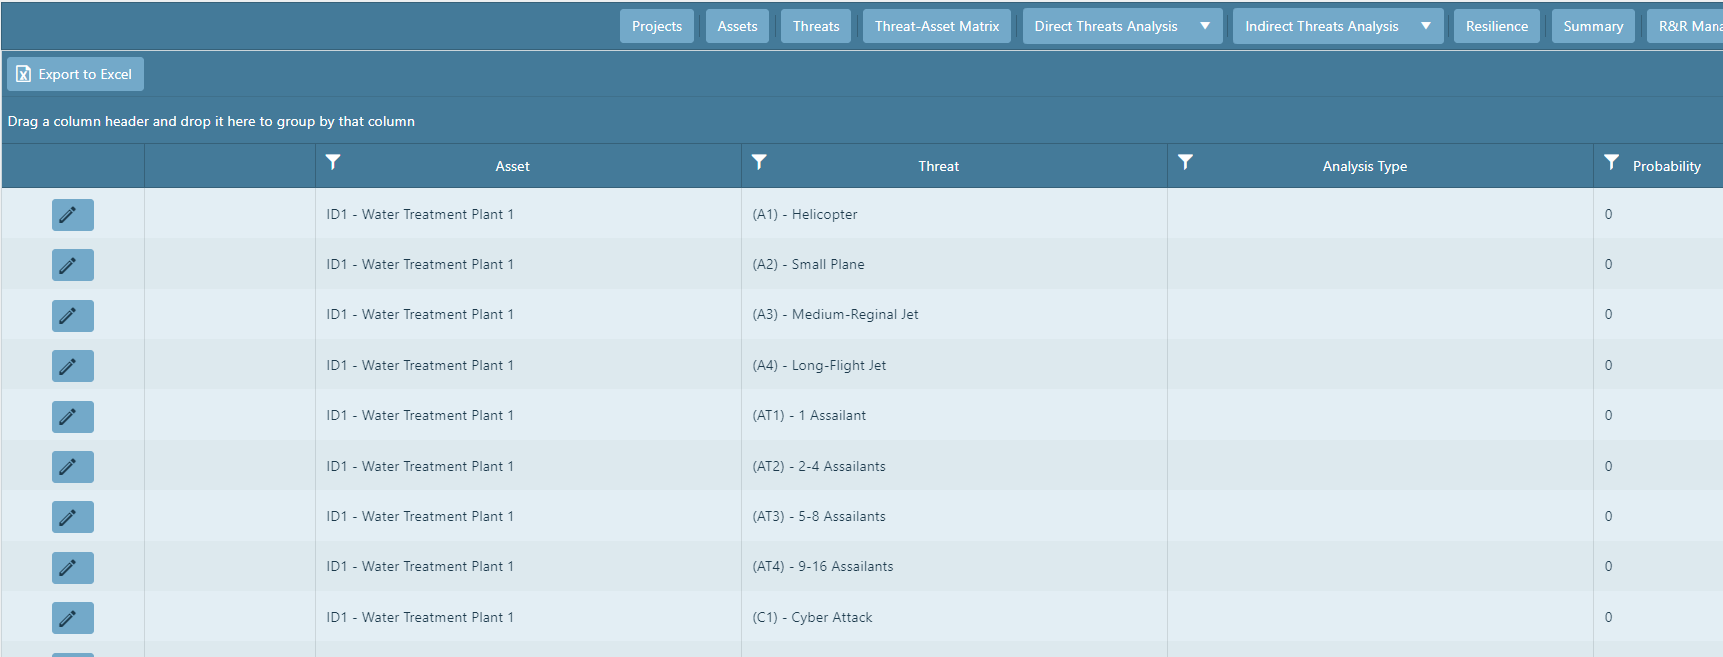
To select an analysis from the Vulnerability Analysis page, click the edit icon next
to the desired threat-asset pair. A pop-up window will appear, and you will be asked to choose what type of analysis you would like to
appoint to your threat-asset pair.
Click on the --Analysis Type-- pull-down and click on an analysis to choose.
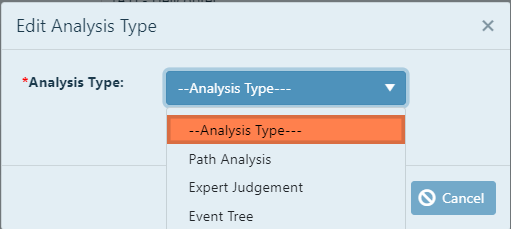
Click the Update  box.
You will then be prompted to begin the analysis through a series of steps. Each analysis method has a set of specific,
required data that must be inputed in order to run. Review the steps for each analysis below.
box.
You will then be prompted to begin the analysis through a series of steps. Each analysis method has a set of specific,
required data that must be inputed in order to run. Review the steps for each analysis below.
Click Cancel to close the Edit Analysis window without saving.
A countermeasure is an action, device, or physical element that reduces risk by affecting an asset, threat, or vulnerability.
This section applies to all analysis types.
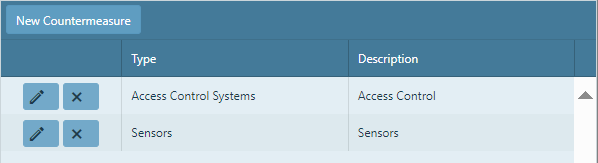
To add a countermeasure to a vulnerability analysis, click the New Countermeasure box. An Add Countermeasure pop-up
will appear and you will be able to create a new countermeasure or add a countermeasure that you have already defined.
Once the pop-up appears, you will have two options. At this point, you may add a
countermeasure that has already been defined (if this is not your first analysis), or create a new one. Once a countermeasure has been created,
it is available for use in any of the vulnerability analysis types for the project and will not have to be created again. To add a new countermeasure, click the New box. Another pop-up window will appear and you will be required to select a countermeasure
type and add a description to your countermeasure.
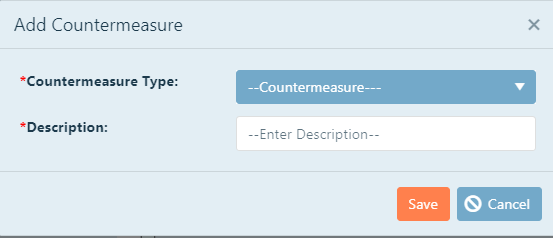
Countermeasure Type:Select the type of countermeasure you would like to add. There are 18 predefined types of countermeasures
you may choose from:
- Access Control Systems: Includes keypad or card swipe access to the asset.
- Alarms: Includes any type of alarm that notifies a response team of an attack.
- Backup Power: On site power that is used to counteract a power outage, such as generators.
- Cameras/Closed Circuit TV: Cameras connected to CCTV system that is monitored by personnel.
- Doors: Any door that an attacker must get past to access its intended target.
- Fence: Perimeter fencing.
- Lighting: Minimizing unlit areas where an attacker may be able to hide.
- Locks: Reinforced locks on doors, windows, or other access points.
- Open Space/Setback: Open space area void of trees or other shrubbery where an attacker may be hiding.
- Other: If your desired countermeasure does not fit into one of these categories, you may choose "Other".
- Security Guard: Hired security personnel.
- Sensors: Includes motion sensors, shake sensors, or other types that would alert responders of presence of an attack.
- Signage: Signs including "no trespassing" and "private property".
- Target: For Path Analysis, you will need the option for "Target", but will NOT use it for any other type of analysis. This will be discussed in section 10.3.
- Training: Training employees to be more aware or to be better capable of.
- Vehicle Barriers: Bollards or other measures to prevent a vehicle from gaining access to an asset.
- Walls: Barriers between an attacker and the asset it is attempting to access.
- Windows: Reinforcing windows to decrease the ease of breaking into a building to attack an asset.
Enter Description: Here you may add any other additional information about the countermeasure, including model
numbers, manufacturers, locations, etc.
Once you have entered the desired information, click Save. The countermeasure will automatically be
added to the threat-asset pair analysis.
Once a countermeasure has been created, it is available for use in any of the vulnerability analysis types and will not have to be created again.
To remove countermeasures you had previously added to the threat-asset pair, click the delete box to the
left of the countermeasure type.
To permenently delete a countermeasure from the entire project, click the edit box next to the countermeasure type to re-open
the add countermeasure window. You will be able to edit the countermeasure information, cancel, or delete the countermeasure from all analysis
by clicking Permenently Delete.
Path analysis breaks down the relationship between the amount of time it will take a threat to gain access
to your asset and the amount of time it takes for a response team to stop the attack. The countermeasures
are measured by detection, delay, and response and the vulnerability is determined by the time taken for
each of these measurements.
Once you have the total response time and attack time, it is the responsibility of your team to determine
the scale on which to rate them. Your final vulnerability number must be between 0 and 1.0.
To begin the vulnerability analysis using a path analysis for a threat-asset pair, click the edit icon
next to the corresponding line. The box pictured below will
appear. Choose Path Analysis from the drop-down menu
for that threat asset pair, and then click Select.
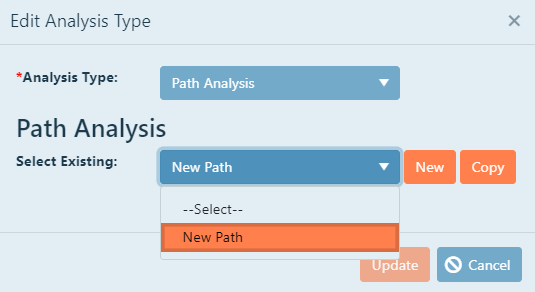
You may either choose an existing path analysis that you have previously developed for another
threat-asset pair, copy an existing analysis and make some changes, or create a new analysis.
To cancel your changes at any time, click Cancel. None of your work will be saved.
To choose an existing path analysis, click the pull down menu, then select the desired choice, and then
click Select.
All of the information previously entered will be displayed on the screen. Simply click Save to save your choice.
If you make changes to the indicator without copying it, the changes will apply to every threat-asset
pair where that particular path analysis was chosen to be used.
To copy an existing path analysis to make a new version, click the pull down menu, select the desired
choice to copy, and then click Copy.
Change the desired information, then click Save Analysis, then click Save. If you click Save before
clicking Save analysis, your changes will NOT be saved.
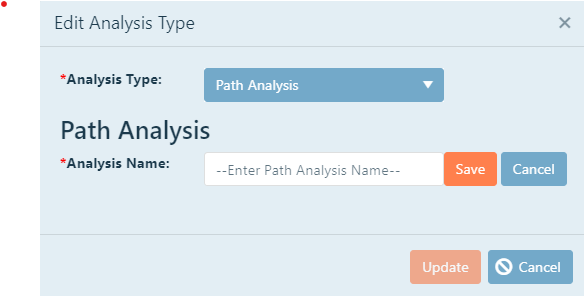
To create a new path analysis, click New.
Give your Path Analysis a name. Click inside the text box, and then type the desired name.
Click New. The Path Analysis will be created in the system and you can now input your countermeasures
Click Update to begin.
There are three parts to completing a path analysis. First, add the applicable countermeasures
protecting the asset against the threat. Second you will add steps to the response path and attack
path. Lastly, you will determine the vulnerability from the time results of the two paths.
The response path in this path analysis includes the steps that would be taken from the time the
adversary is detected, until the time the adversary is intercepted from carrying out his plan. This
includes the time it takes to identify the problem, notify responders (police, security, etc.), travel
time, and interception time once responders arrive on site.
To add a step to the response path, click New Response Path.
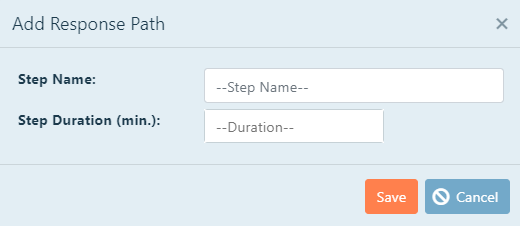
Give the step a name that describes what occurs during that step. Click inside the text box, and then
type the desired name.
Determine the duration of that step. This is the total time, in minutes, it takes to complete the
step. Click inside the text box, and then type the desired time.
Click Save when complete.
The Step number describes the order in which the events occur. The number will populate for you
automatically in chronological order. If you miss a step, click the check box on one step above or below where you want the new step to be. Click Insert Above Selection or Insert Below Selection to add in the new step. The following steps will adjust automatically.
To remove a step from the response path that you have previously added, click the button.
Continue to add steps until the total response path is recorded. An example is shown below.
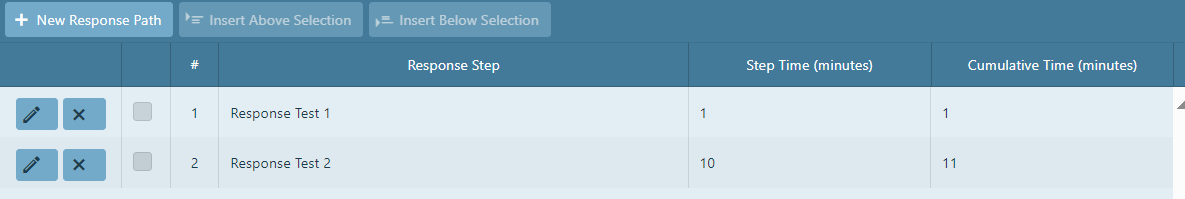
The response step displays the order of events.
The step time displays the duration of each step.
The cumulative time displays the cumulative total time at each step, concluding with the final total
response time (in this case, 11 minutes).
To add a step to the attack path, click New Attack Path.
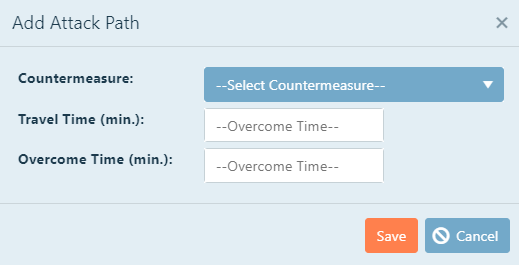
Countermeasure: The associated countermeasure that the attacker will be facing at each step.
Travel Time: The amount of time (in minutes) it takes for the attacker to reach the current
countermeasure/the target AFTER he has overcome the previous one.
Overcome Time: The amount of time (in minutes) it takes for the attacker to overcome or defeat
the countermeasure. Examples include time to break through a door, climb over a wall, or break a
lock.
To choose a countermeasure, click the drop down menu, and then select the desired choice.
To edit the travel time or the overcome time, click inside the text box,
and then type the desired number.
Click Save when complete.
To remove a step from the attack path that you have previously added, click the button.
Continue to add steps until the total attack path is recorded. An example is shown below.
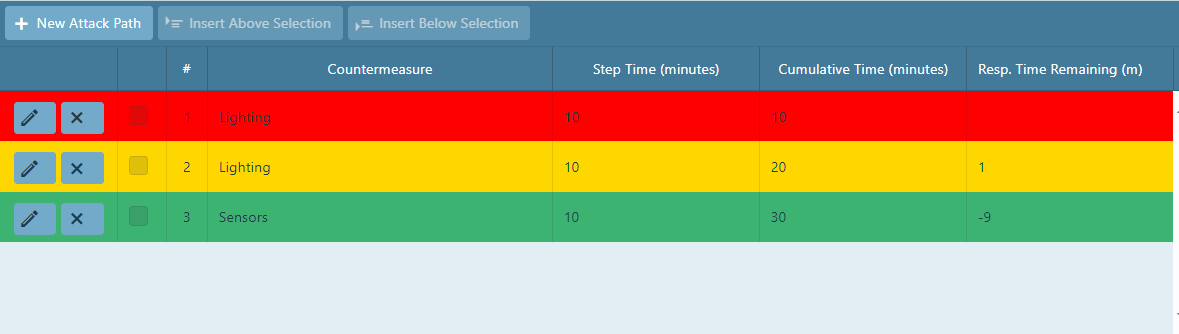
The Step Time displays the total amount of time it takes to complete that step. It is the sum of the travel time and the overcome time.
The Cumulative Time displays the cumulative total time at each step, concluding with the total attack time (30 minutes in this case).
The Response Time Remaining displays the amount of time until the responders are able to apprehend the attacker.
Color coding is as follows:
-
Red: The attacker has overcome the countermeasure, but has not been detected yet.
The response time has not started.
-
Orange: The attacker is continuing on his path towards the target asset but has been detected and
the response time has started.
-
Green: The attacker has been intercepted and was unable to carry out his plan. If your attack
path does not show any steps of this color, then the attacker has succeeded.
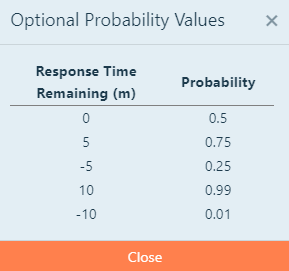
Once you have completed the analysis, you can use the Response Time Remaining value and apply it to the
Optional Probability Values located in the top right of the page next to the Save and Close button. It is
also listed below.
Direct expert judgement does not require any mathematical calculations or analyses to be entered into
the PARRE™ program, but it is necessary to involve experts that are familiar with your assets as well as the
threats that could affect them. Involving local, state, and federal agencies in discussions is recommended.
Based on these discussions, you will input a value between 0 and 1.0 for each asset/threat pair.
To begin the vulnerability analysis using direct expert judgement for a threat-asset pair, you will be asked to provide a
calculated probability and add any countermeasures the asset has. You can also add notes for your own reference by
typing in the Notes box under Probability.
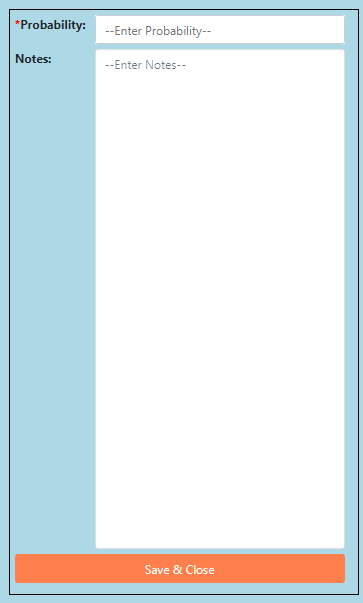
To update the vulnerability value, click inside the Probability editable text box and then type the desired value.
To add a countermeasure to the asset's analysis, see Adding a Countermeasure.
To save your work, click Save. You will return to the vulnerability analysis page
To edit the type of analysis an asset-threat pair has, click the edit box to the left of the asset name column.
To edit the analysis itself, double-click on the analysis type box correlating to the desired asset. This will re-open the
analysis window and you will be able to modify any of the information previously inputed.
An event tree uses the probabilities of success and failure rates of a threat attacking your assets.
Once an event tree is selected for the analysis type, you will either add a new event or select an existing event (one previously added).
You may either choose an existing event tree that you have previously developed for another threat-asset
pair, copy an existing tree and make some changes, or create a new tree.
To choose an existing event tree, click the pull down menu and select the desired choice. All of the information previously entered will be displayed on the screen. Simply click Update to
save your choice. If you have already created an event tree, it will appear as an existing event tree (will appear in the Select Existing scroll-down) and, if chosen, will copy the entire event tree
to your asset. This copy can be identified by the copy number added to the end (eg. (1) ). Find an existing tree in the scroll-down,
click copy, then click Update to bring up the event window to edit/add/delete nodes.
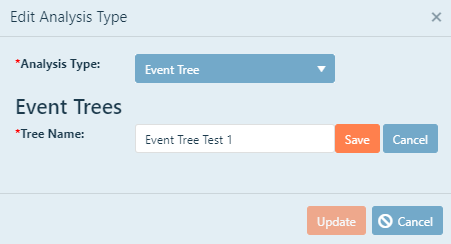
To create a new event tree, click New.
Give your Event Tree a name. Click inside the text box, and then type the desired name.
Click Save. The Event Tree will be created in the system and you can now input your countermeasures
Click Update to continue.
There are three parts to completing an event tree. First, add the applicable countermeasures
protecting the asset against the threat. Second you will add steps to the event tree.
Lastly, you will determine the vulnerability from the product of all events in the event tree.
Click the Start box to begin adding nodes to your event path. Each node should be a countermeasure
the assailant will have to overcome to successfully carry out their mission. With each node you add, you
will need to create a success name, failure name, and success probability.
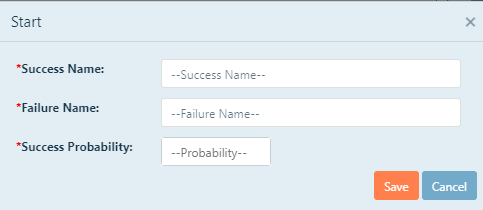
Success Name: Click inside the text box, then type name you would like to use for the successful
branch. This is the action taken by the attacker that would succeed in overcoming a countermeasure.
Failure Name: Click inside the text box, then type the name you would like to use for the failure
branch. This is the action taken by the attacker that would fail in overcoming a countermeasure.
Success Probability: Click inside the text box, then type the probability between 0 and 1.0 that the
attacker will succeed in overcoming the countermeasure.
You can add, edit, and delete nodes by clicking on a node. To add a new node to your tree, click the node you would like to
add on to. The node box will pop up and you will need to click Add New to add a node branch to a node.
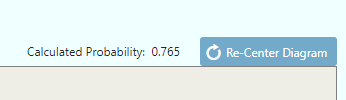
As branches are added to the event, the probability of that event happening is calculated and displayed above the tree display box.
To re-center the path in the event window, click the Re-Center Diagram next to the calculated probability display.
The Vulnerability of the assessed threat asset pair is shown at the top of the screen at all times next to
Calculated Probability.
To save and close this page, click the Save and Close button in the top right of the page.
Threat likelihood evaluates the probability that a threat will occur against an asset within one year.
There are two (2) methods that are available for determining the threat likelihood of your assets to malevolent attacks:
-
Best Estimate—does not involve any required procedures. This value between zero and one is determined based on informed
opinions from law enforcement, intelligence agencies, and/or the professional opinions of your group.
-
Proxy Indicator—a holistic approach developed by RAND Corporation and Risk Management Solutions, Inc. This process determines
the probability, based on the attractiveness of a target, of a terrorist attack. You will answer a few questions about the location
of your facility/system to determine the threat likelihood.
To select an analysis from the Threats Likelihood page, click the edit icon next
to the desired asset. A pop-up window will appear, and you will be asked to choose what type of analysis you would like to
appoint to your asset.
Click on the --Analysis Type-- scroll bar and click on an analysis to choose.
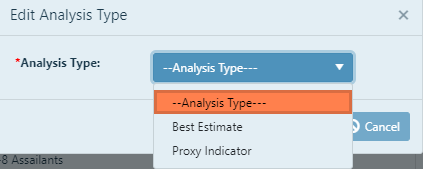
Click Update to save the analysis type and close the Edit Analysis window.
Click Cancel to close the Edit Analysis window without saving.
The best estimate threat likelihood does not involve any required procedures. This value between zero and
one is determined based on informed opinions from law enforcement, intelligence agencies, and/or the
professional opinions of your group.
Choose Best Estimate from the drop-down menu for that threat asset pair. This action is accessed by clicking
the edit box next to the asset-threat pair.
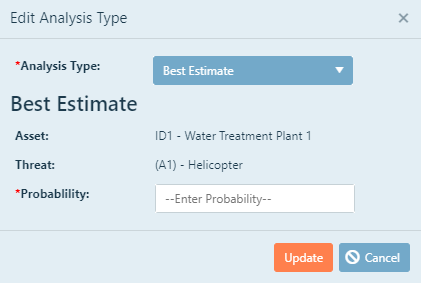
Once a best estimate is selected for the analysis type, all you are required provide is a desired threat likelihood as
a probability. Click inside the --Enter Probability-- box, and then type the desired threat likelihood as a probability
between 0 and 1.0.
Click Update when finished.
To exit without saving your choice, click Cancel.
The proxy indicator method for determining the threat likelihood for a malevolent threat attacking your
assets is a holistic approach developed by RAND Corporation and Risk Management Solutions, Inc. This
process determines the probability, based on the attractiveness of a target, of a terrorist type attack. You
will answer a few questions about the location of your facility/system to determine the threat likelihood.
Choose Proxy Indicator from the drop-down menu for that threat asset pair. This action is accessed by clicking
the edit box next to the asset-threat pair.
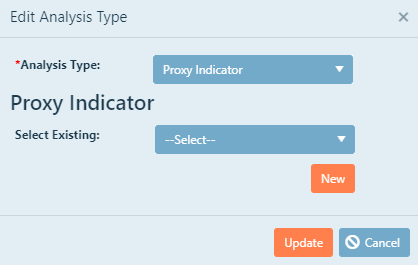
You may either choose an existing proxy indicator that you have previously developed for another
threat-asset pair (if this is not your first analysis), copy an existing analysis and make some minor changes, or create a new analysis.
To create a new proxy indicator, click New. The following window will appear and you will be able to imput the cooresponding information:
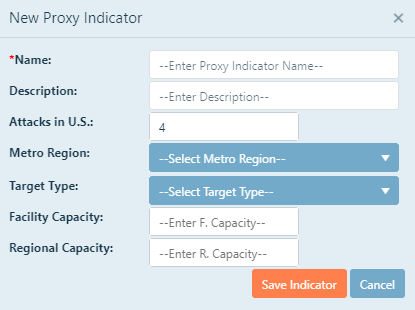
Name: Give your Proxy Indicator analysis a name. Click inside the text box, and then type the desired
name.
Description: Give your Proxy indicator a description. You may use any description that will help you identify
it from other indicators. Click inside the text box, and then type the desired description.
Attacks in U.S.: The first node is the number of attacks in the US (per year). The value defaults to 4.
User will have to click in the text box if they want something other than 4.
Metro Region: Select your metro region by clicking the pull down menu, and then selecting your region from the
list. If your facility is not located in one of these metro regions, select Other. If you selected Other, then you must give the population of your metro region. If you selected
one of the pre-determined regions, then you will not enter a population. Click inside the text box, and then type the population of your metro region.
Target Type: Select the target type of your facility clicking the pull down menu and then selecting your type of
facility. If you are evaluating a water treatment plant, you should select the industrial facilities option. If you are
evaluating source water/distribution system, you should select water reservoirs and distribution option.
Facility Capacity: Enter the capacity of your facility. This may be the MGD you produce.
Click inside the text box, and then type the capacity.
Regional Capacity: Enter the capacity of all facilities of your subtype in your region. This number will not be
greater than the Facility Capacity. Click inside the text box, and then type the capacity.
When finished entering the above data, click Save Indicator and then click Update to continue the analysis.
To cancel your changes at any time, click Cancel. None of your work will be saved.
To choose an existing proxy indicator, click the pull down menu then select the desired choice. All of the information
previously entered will be displayed on the screen. You can edit this analyses information or copy the analysis and then modify the information to create a different analysis.
If you make changes to the indicator without copying it, the changes will apply to every threat-asset pair
where that particular proxy indicator was chosen to be used.
To copy an existing proxy indicator to make a new version, click the pull down menu, select the desired
choice to copy, and then click Copy. Change the desired information, click Save, then
click Update.
Natural hazard analysis is performed differently than malevolent or dependency and proximity threat
analysis. The ANSI/AWWA J-100 standard outlines specific methods for determining the risk of
each natural hazard based on your location. The natural hazards that are required to be analyzed are
hurricanes, earthquakes, tornadoes, floods, wildfires, and ice storms.
To begin an evaluation of a natural hazard threat-asset pair, click the edit button on the desired pair you
would like to evaluate. Steps on how to complete the analysis are broken down by threat below.
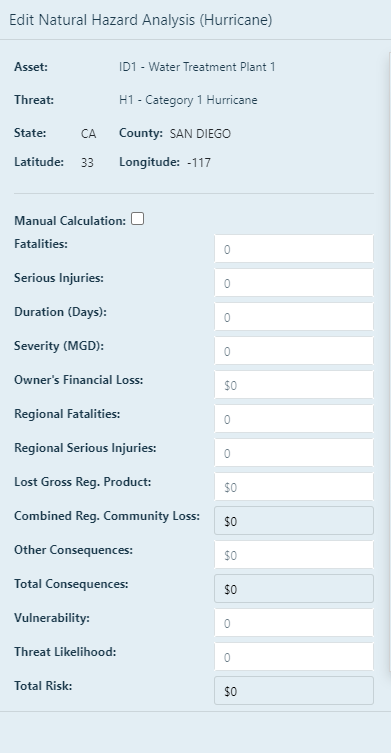
The method used to evaluate the risk to your assets from hurricanes is detailed in the AWWA J100
Standard. You can use the calculator built into PARRE™ to evaluate hurricane risk, or you can manually
input consequence, vulnerability, and threat likelihood values based on a method of your choice.
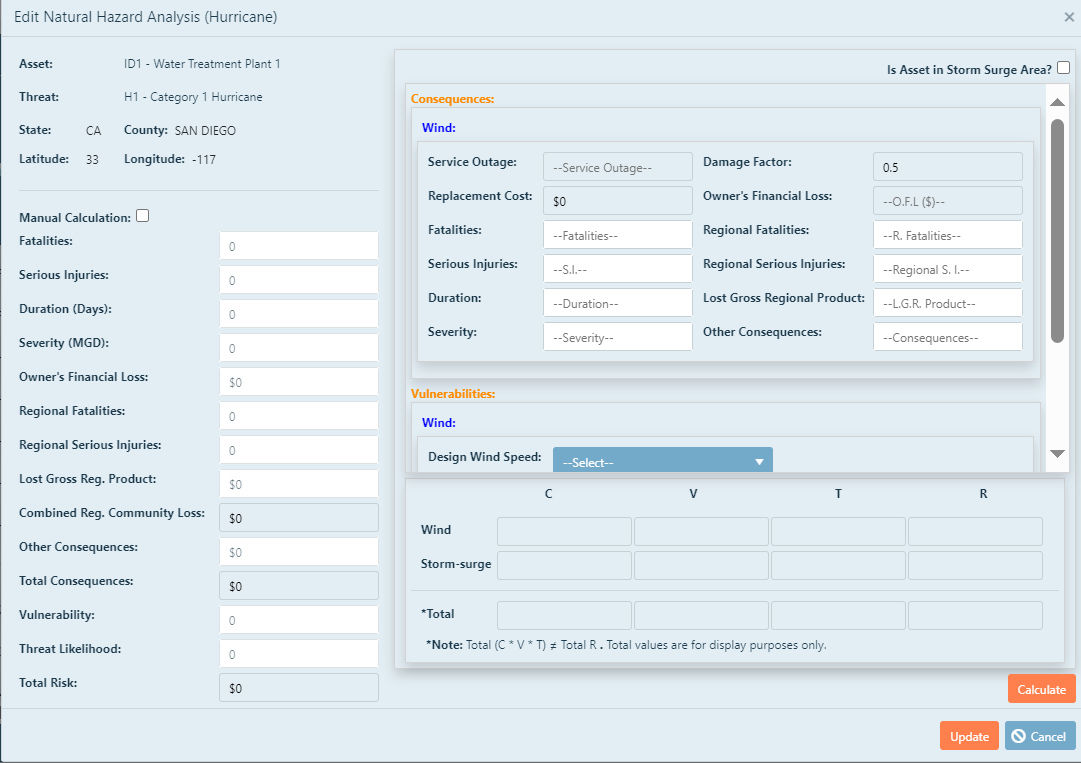
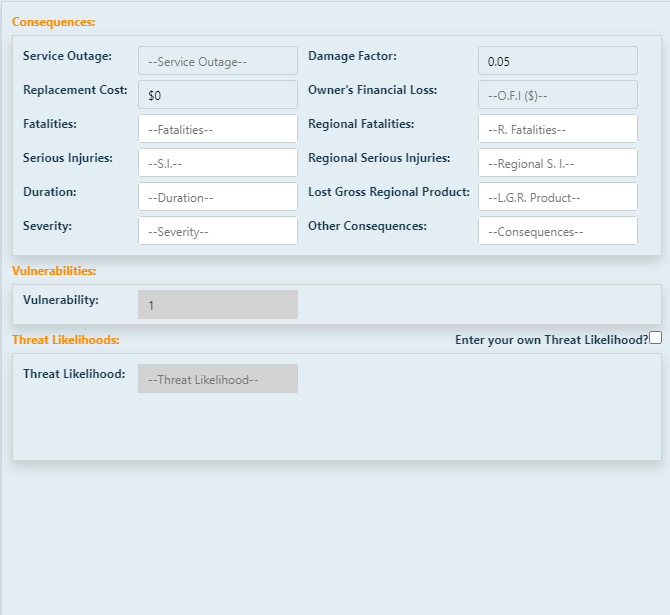
If you would like to utilize the natural hazard calculator in PARRE™, you will need to fill out the
information on the right side of the screen.
The replacement cost and damage factor are populated for you based on the information you gave in the asset
characterization screen.
First, enter the number of fatalities that would reasonably occur for each category if a hurricane struck the asset by
clicking in the text box and entering the value.
Enter the number of serious injuries that would reasonably occur for each category if a hurricane struck the
asset by clicking in the text box and entering the value.
Next, enter the duration, in days, that the asset would reasonably be down for each category if a hurricane struck the
asset by clicking in the text box and entering the value.
Then, the severity, in MGD, of the outage for the asset is entered in the next text box for each category of hurricane.
Next, enter the number of regional fatalities that would reasonably occur for each category if a hurricane struck the asset by
clicking in the text box and entering the value.
Enter the number of regional serious injuries that would reasonably occur for each category if a hurricane struck the
asset by clicking in the text box and entering the value.
Enter the lost gross regional product that would reasonably occur for each category if a hurricane struck the
asset by clicking in the text box and entering the value.
Enter any other consequences that would reasonably occur for each category if a hurricane struck the
asset by clicking in the text box and entering the value, that are not included in the other categories.
Select the design speed, in mph, in the drop down box. The design speed is the wind speed that your asset was
built to withstand. This is usually equal to or greater than the design speed detailed in your building codes.
The hurricane profile is created in order to gather information needed for the calculator. The information
gathered here, combined with other data in the database, will calculate the financial impacts, vulnerability,
threat likelihood, and risk for you.
To choose an existing profile, click the drop-down menu, and then choose the desired profile. You should only
have to create one profile for the project, unless your assets are spread out over a large area.
To edit an existing profile, click Edit Selected Profile.
For the first use of the calculator, or to add a new profile, click Add New Profile. The following
screen will appear:
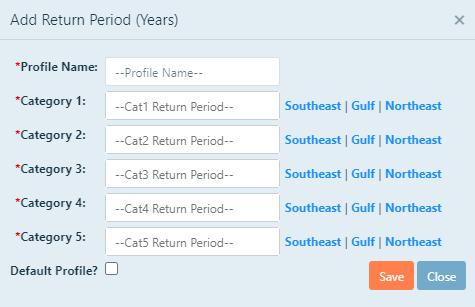
In the text box at the top of the page, type a name for the hurricane profile.
Next, enter the return period, in years, for each category of hurricane for your area. Maps
containing this information are located in the J100 Standard. You can also access the maps by
clicking the links to the right of the text box.
If you would like to make this profile a default profile, check the box labelled Make Default. If you
make a profile the default profile, it will automatically populate in the calculator.
Once the information in the calculator is populated, click Calculate. The consequences, vulnerability,
threat likelihood, and risk values will calculate for you. The results will be for each category, and the total
value is summarized in the bottom row.
When finished, click Update. To discard your work, click Close
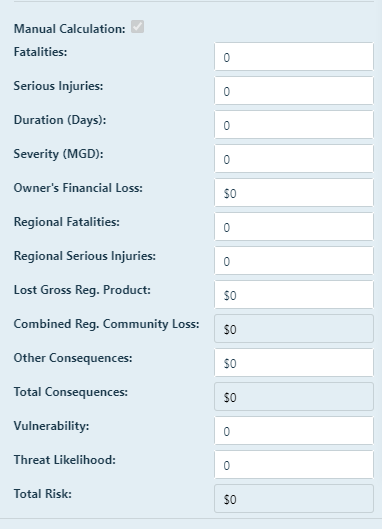
If you would like to enter your own values for financial impact, vulnerability, and threat likelihood,
check the box labelled Manual Calculations, and then enter the desired values in the
designated text boxes. The manually calculate button is only active if you choose to enter your own values.
First, enter the number of fatalities that would reasonably occur if a hurricane struck the asset by
clicking in the text box and entering the value.
Second. enter the number of serious injuries that would reasonably occur if a hurricane struck the
asset by clicking in the text box and entering the value.
Next, Enter the duration, in days, that the asset would reasonably be down if a hurricane struck the
asset by clicking in the text box and entering the value.
The severity, in MGD, of the outage for the asset is entered in the next text box for each category of hurricane.
Next, add the financial impact to the utility that would reasonably occur due to a hurricane striking
the asset, in dollars, can be entered.
Next, enter the number of regional fatalities that would reasonably occur for each category if a hurricane struck the asset by
clicking in the text box and entering the value.
Enter the number of regional serious injuries that would reasonably occur for each category if a hurricane struck the
asset by clicking in the text box and entering the value.
Enter the lost gross regional product that would reasonably occur for each category if a hurricane struck the
asset by clicking in the text box and entering the value.
Enter any other consequences that would reasonably occur for each category if a hurricane struck the
asset by clicking in the text box and entering the value, that are not included in the other categories.
Enter any other consequences that would reasonably occur for each category if a hurricane struck the
asset by clicking in the text box and entering the value, that are not included in the other categories.
Add the Vulnerability. The vulnerability is a value between 0 and 1 indicating the ability of the asset to resist
the hurricane.
Add the Threat Likelihood. The threat likelihood is the probability the hurricane will occur in a given year between 0 and 1.
When you are finished calculating the risk to hurricanes, click Calculate Manually and Update. To discard your work, click
Cancel.
The method used to evaluate the risk to your assets from earthquakes is detailed in the AWWA J100
Standard. You can manually input consequence, vulnerability, and threat likelihood values based on a method of your choice.
First, enter the number of fatalities that would reasonably occur for each category if an earthquake struck the asset by
clicking in the text box and entering the value.
Enter the number of serious injuries that would reasonably occur for each category if an earthquake struck the
asset by clicking in the text box and entering the value.
Next, enter the duration, in days, that the asset would reasonably be down for each category if an earthquake struck the
asset by clicking in the text box and entering the value.
Then, the severity, in MGD, of the outage for the asset is entered in the next text box for each category of earthquake.
Next, enter the amount of owner's financial loss that would reasonably occur if an earthquake struck the asset by
clicking in the text box and entering the value.
Next, enter the number of regional fatalities that would reasonably occur for each category if an earthquake struck the asset by
clicking in the text box and entering the value.
Enter the number of regional serious injuries that would reasonably occur for each category if an earthquake struck the
asset by clicking in the text box and entering the value.
Enter the lost gross regional product that would reasonably occur for each category if an earthquake struck the
asset by clicking in the text box and entering the value.
Enter any other consequences that would reasonably occur for each category if an earthquake struck the
asset by clicking in the text box and entering the value, that are not included in the other categories.
Add the Vulnerability. The vulnerability is a value between 0 and 1 indicating the ability of the asset to resist
the earthquake.
Add the Threat Likelihood. The threat likelihood is the probability the earthquake will occur in a given year between 0 and 1.
Once the information in the calculator is populated, click Calculate Manually. The combined regional community loss, total consequences, and total risk
values will calculate for you.
When you are finished calculating the risk to earthquakes, click Update. To discard your work, click
Cancel.
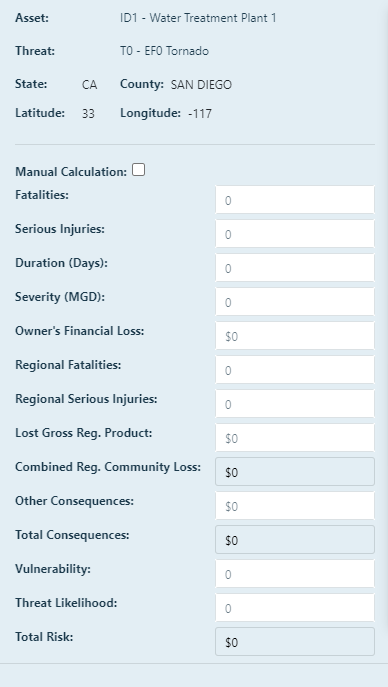
The method used to evaluate the risk to your assets from tornadoes is detailed in the AWWA J100
Standard. You can use the calculator built into PARRE™ to evaluate tornado risk, or you can manually
input consequence, vulnerability, and threat likelihood values based on a method of your choice.
Regardless of the method you choose, there is some information that should be entered.
First, enter the number of fatalities that would reasonably occur for each category if a tornado struck the asset by
clicking in the text box and entering the value.
Enter the number of serious injuries that would reasonably occur for each category if a tornado struck the
asset by clicking in the text box and entering the value.
Next, enter the duration, in days, that the asset would reasonably be down for each category if a tornado struck the
asset by clicking in the text box and entering the value.
Then, the severity, in MGD, of the outage for the asset is entered in the next text box for each category of tornado.
Next, enter the amount of owner's financial loss that would reasonably occur if a tornado struck the asset by
clicking in the text box and entering the value.
Next, enter the number of regional fatalities that would reasonably occur for each category if a tornado struck the asset by
clicking in the text box and entering the value.
Enter the number of regional serious injuries that would reasonably occur for each category if a tornado struck the
asset by clicking in the text box and entering the value.
Enter the lost gross regional product that would reasonably occur for each category if a tornado struck the
asset by clicking in the text box and entering the value.
Enter any other consequences that would reasonably occur for each category if a tornado struck the
asset by clicking in the text box and entering the value, that are not included in the other categories.
If you would like to enter your own values for vulnerability and threat likelihood,
check the box labelled Manual Calculation, and then enter the desired values in the
designated text boxes. When finished, click Calculate Manually. The calculate button turns into the Calculate Manually button
only if you choose to enter your own values.
First, enter the number of fatalities that would reasonably occur if a tornado struck the asset by
clicking in the text box and entering the value.
Second. enter the number of serious injuries that would reasonably occur if a tornado struck the
asset by clicking in the text box and entering the value.
Next, enter the duration, in days, that the asset would reasonably be down if a tornado struck the
asset by clicking in the text box and entering the value.
The severity, in MGD, of the outage for the asset is entered in the next text box.
Next, add the owner's financial loss that would reasonably occur due to a tornado striking
the asset, in dollars, can be entered.
Next, enter the number of regional fatalities that would reasonably occur for each category if a tornado struck the asset by
clicking in the text box and entering the value.
Enter the number of regional serious injuries that would reasonably occur for each category if a tornado struck the
asset by clicking in the text box and entering the value.
Enter the lost gross regional product that would reasonably occur for each category if a tornado struck the
asset by clicking in the text box and entering the value.
Enter any other consequences that would reasonably occur for each category if a tornado struck the
asset by clicking in the text box and entering the value, that are not included in the other categories.
Add the Vulnerability. The vulnerability is a value between 0 and 1 indicating the ability of the asset to resist
the tornado.
Add the Threat Likelihood. The threat likelihood is the probability the tornado will occur in a given year between 0 and 1.
When you are finished calculating the risk to tornadoes, click Update. To discard your work, click
Cancel.
The method used to evaluate the risk to your assets from flooding is detailed in the AWWA J100
Standard. You can use the calculator built into PARRE™ to evaluate flood risk, or you can manually
input consequence, vulnerability, and threat likelihood values based on a method of your choice.
Regardless of the method you choose, there is some information that should be entered.
If you would like to use the calculator built into PARRE™ to evaluate flood risk, you will be using the right side of the screen.
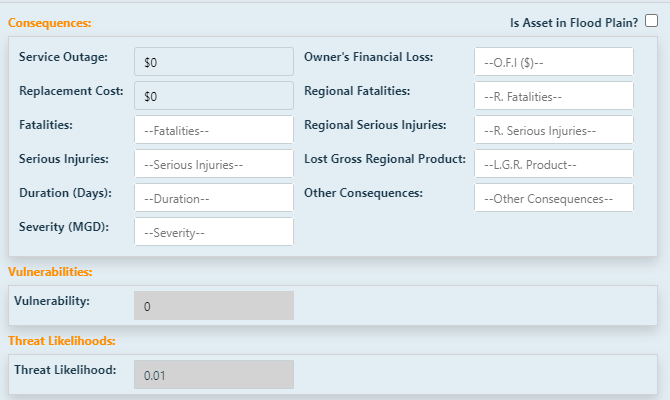
First, If the asset is vulnerable to floods, and is located in the 100-year flood plain or 500 year flood plain (depending on which threat you are utilizing),
click the box labelled
Is Asset in Flood Plain?.
Enter the number of fatalities that would reasonably occur if a flood of the chosen magnitude struck the asset by
clicking in the text box and entering the value.
Then, enter the number of serious injuries that would reasonably occur if a flood of the chosen magnitude struck the
asset by clicking in the text box and entering the value.
Next, enter the duration, in days, that the asset would reasonably be down if a flood of the chosen magnitude struck the
asset by clicking in the text box and entering the value.
The severity, in MGD, of the outage for the asset is entered in the next text box.
Next, add the owner's financial loss that would reasonably occur due to a flood of the chosen magnitude striking
the asset, in dollars, can be entered.
Next, enter the number of regional fatalities that would reasonably occur for each category if a flood of the chosen magnitude struck the asset by
clicking in the text box and entering the value.
Enter the number of regional serious injuries that would reasonably occur for each category if a flood of the chosen magnitude struck the
asset by clicking in the text box and entering the value.
Enter the lost gross regional product that would reasonably occur for each category if a flood of the chosen magnitude struck the
asset by clicking in the text box and entering the value.
Enter any other consequences that would reasonably occur for each category if a flood of the chosen magnitude struck the
asset by clicking in the text box and entering the value, that are not included in the other categories.
Once the information in the calculator is populated, click Calculate. The vulnerability and
threat likelihood will calculate for you.
When you are finished calculating the risk to flooding, click Update. To discard your work, click
Cancel.
If you would like to use the manual calculator to evaluate flood risk, you will be using the left side of the screen.
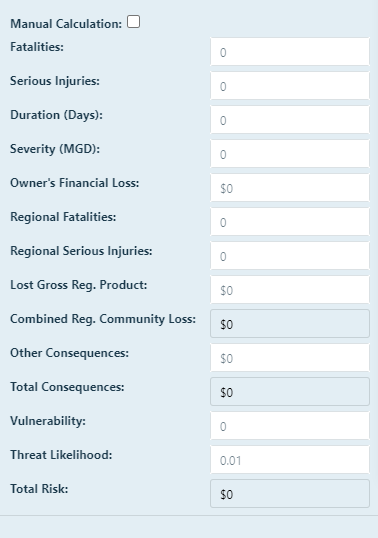
First, enter the number of fatalities that would reasonably occur if a flood of the chosen magnitude struck the asset by
clicking in the text box and entering the value.
Second, enter the number of serious injuries that would reasonably occur if a flood of the chosen magnitude struck the
asset by clicking in the text box and entering the value.
Next, enter the duration, in days, that the asset would reasonably be down if a flood of the chosen magnitude struck the
asset by clicking in the text box and entering the value.
The severity, in MGD, of the outage for the asset is entered in the next text box.
Next, add the owner's financial loss that would reasonably occur due to a flood of the chosen magnitude striking
the asset, in dollars, can be entered.
Next, enter the number of regional fatalities that would reasonably occur for each category if a flood of the chosen magnitude struck the asset by
clicking in the text box and entering the value.
Enter the number of regional serious injuries that would reasonably occur for each category if a flood of the chosen magnitude struck the
asset by clicking in the text box and entering the value.
Enter the lost gross regional product that would reasonably occur for each category if a flood of the chosen magnitude struck the
asset by clicking in the text box and entering the value.
Enter any other consequences that would reasonably occur for each category if a flood of the chosen magnitude struck the
asset by clicking in the text box and entering the value, that are not included in the other categories.
Add the Vulnerability. The vulnerability is a value between 0 and 1 indicating the ability of the asset to resist
the flood.
Add the Threat Likelihood. The threat likelihood is the probability the flood will occur in a given year between 0 and 1.
When you are finished calculating the risk to floods, click Calculate Manually and Update. To discard your work, click
Cancel.
The method used to evaluate the risk to your assets from wildfires is not detailed in the AWWA J100
Standard. AEM Corperation has developed a method to assess wildfires and has included it in the software.
This method evaluates the consequences, vulnerabilities, and threat likelihoods for both a minor and major
wildfire. You can also manually input consequence, vulnerability,
and threat likelihood values based on a method of your choice.
You will need to follow the same steps below for minor and major wildfires.
First, enter the number of fatalities that would reasonably occur if a wildfire struck the asset by
clicking in the text box and entering the value.
Second, enter the number of serious injuries that would reasonably occur if a wildfire struck the
asset by clicking in the text box and entering the value.
Next, enter the duration, in days, that the asset would reasonably be down if a wildfire struck the
asset by clicking in the text box and entering the value.
The severity, in MGD, of the outage for the asset is entered in the next text box.
Next, add the owner's financial loss that would reasonably occur due to a wildfire striking
the asset, in dollars, can be entered.
Next, enter the number of regional fatalities that would reasonably occur for each category if a wildfire struck the asset by
clicking in the text box and entering the value.
Enter the number of regional serious injuries that would reasonably occur for each category if a wildfire struck the
asset by clicking in the text box and entering the value.
Enter the lost gross regional product that would reasonably occur for each category if a wildfire struck the
asset by clicking in the text box and entering the value.
Enter any other consequences that would reasonably occur for each category if a wildfire struck the
asset by clicking in the text box and entering the value, that are not included in the other categories.
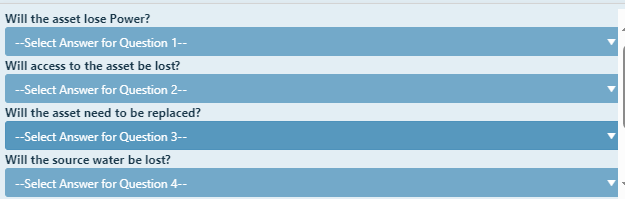
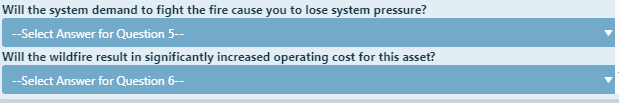
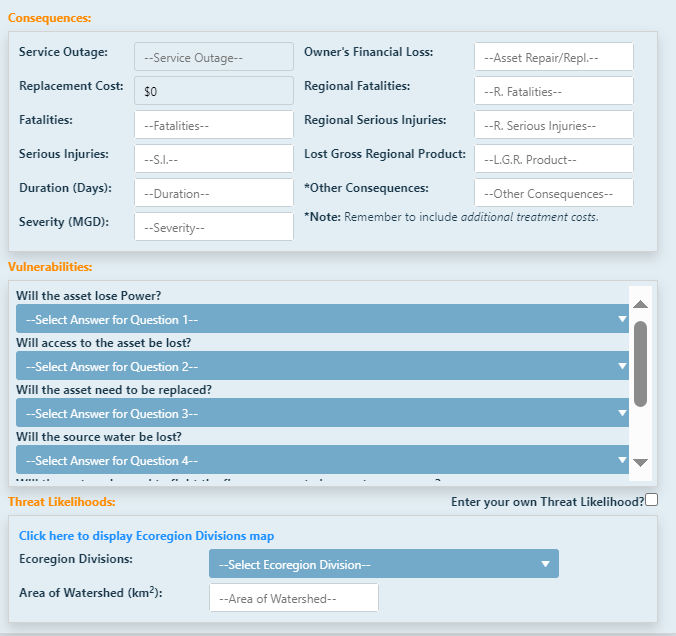
Next, the system will calculate the vulnerability based on the answers to six questions.
When you have answered these questions, continue scrolling down and repeat the process for major wildfires.
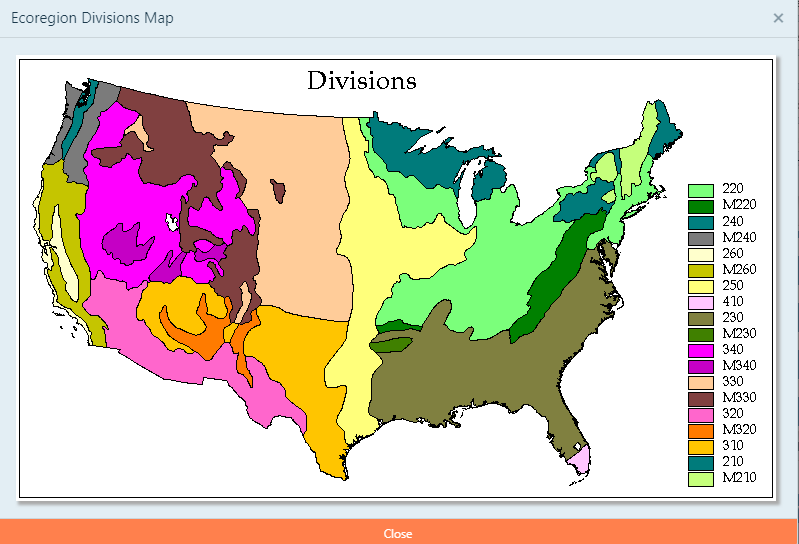
After the major wildfire section, we will now calculate our threat likelihood. Click on the ecoregion divisions map (also shown below),
determine where your asset is located, and press the Close button. Select that ecoregion from the drop down map and
enter the area of the watershed for the asset.
When you are finished inputing values, press the calculate button, and a results table will appear.
If you would like to enter your own values for vulnerability and threat likelihood,
check the box labelled Manual Calculation, and then enter the desired values in the
designated text boxes. The calculate button turns into the Calculate Manually button only if you choose to enter your own values.
First, enter the number of fatalities that would reasonably occur if a wildfire struck the asset by
clicking in the text box and entering the value.
Second, enter the number of serious injuries that would reasonably occur if a wildfire struck the
asset by clicking in the text box and entering the value.
Next, enter the duration, in days, that the asset would reasonably be down if a wildfire struck the
asset by clicking in the text box and entering the value.
The severity, in MGD, of the outage for the asset is entered in the next text box.
Next, add the owner's financial loss that would reasonably occur due to a wildfire striking
the asset, in dollars, can be entered.
Next, enter the number of regional fatalities that would reasonably occur for each category if a wildfire struck the asset by
clicking in the text box and entering the value.
Enter the number of regional serious injuries that would reasonably occur for each category if a wildfire struck the
asset by clicking in the text box and entering the value.
Enter the lost gross regional product that would reasonably occur for each category if a wildfire struck the
asset by clicking in the text box and entering the value.
Enter any other consequences that would reasonably occur for each category if a wildfire struck the
asset by clicking in the text box and entering the value, that are not included in the other categories.
Add the Vulnerability. The vulnerability is a value between 0 and 1 indicating the ability of the asset to resist
the wildfire.
Add the Threat Likelihood. The threat likelihood is the probability the wildfire will occur in a given year between 0 and 1.
When you are finished calculating the risk to floods, click Calculate Manually and Update. To discard your work, click
Cancel.
When you are finished calculating the risk to wildfires, click Save. To discard your work, click
Cancel.
The method used to evaluate the risk to your assets from ice storms is developed internally by AEM
Corporation, due to a lack of a defined method in the J100 Standard. There are five levels of ice storms: 3 Hour Outage Ice Storm, 1 Day Outage Ice Storm, 5 Day Outage Ice Storm, 10 Day Outage Ice Storm, and 21 Day Outage Ice Storm.
You can use the calculator built into PARRE™ that utilizes the developed method to evaluate ice storm risk, or you can manually input
consequence, vulnerability, and threat likelihood values based on a method of your choice. Regardless
of the method you choose, there is some information that should be entered.
If you would like to utilize the natural hazard calculator in PARRE™, you will need to fill out the
information on the right side of the screen. The additional information needed is located in the
following section:
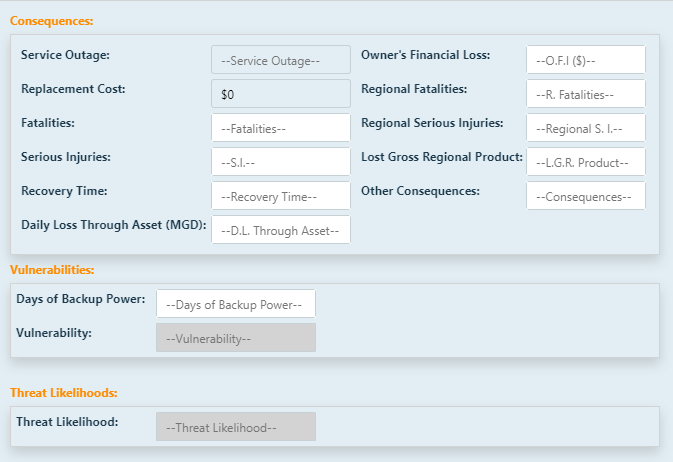
First, enter the number of fatalities that would reasonably occur if an ice storm struck the asset by
clicking in the text box and entering the value.
Second, enter the number of serious injuries that would reasonably occur if an ice storm struck the
asset by clicking in the text box and entering the value.
Next, enter the duration, in days, that the asset would reasonably be down if an ice storm struck the
asset by clicking in the text box and entering the value.
The severity, in MGD, of the outage for the asset is entered in the next text box.
Next, add the owner's financial loss that would reasonably occur due to an ice storm striking
the asset, in dollars, can be entered.
Next, enter the number of regional fatalities that would reasonably occur for each category if an ice storm struck the asset by
clicking in the text box and entering the value.
Enter the number of regional serious injuries that would reasonably occur for each category if an ice storm struck the
asset by clicking in the text box and entering the value.
Enter the lost gross regional product that would reasonably occur for each category if an ice storm struck the
asset by clicking in the text box and entering the value.
Enter any other consequences that would reasonably occur for each category if an ice storm struck the
asset by clicking in the text box and entering the value, that are not included in the other categories.
Next, enter the number of days you have of back-up power for the asset. This is most likely in the form
of an on-site generator.
Once the information in the calculator is populated, click Calculate. The fatalities, serious
injuries,consequences, vulnerability, threat likelihood, and risk values will calculate for you.
If you would like to enter your own values for vulnerability and threat likelihood,
check the box labelled Manual Calculation on the left hand side of the screen, and then enter the desired values in the
designated text boxes. The calculate button turns into the Calculate Manually button only if you choose to enter your own values.
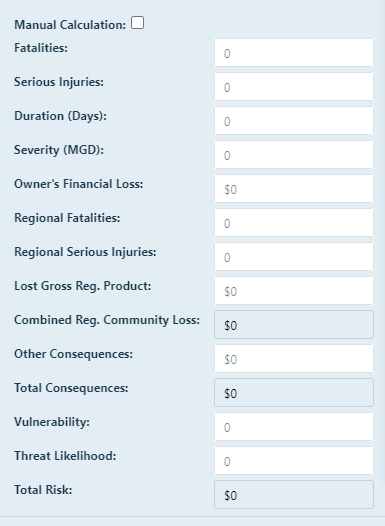
First, enter the number of fatalities that would reasonably occur if an ice storm struck the asset by
clicking in the text box and entering the value.
Second, enter the number of serious injuries that would reasonably occur if an ice storm struck the
asset by clicking in the text box and entering the value.
Next, enter the duration, in days, that the asset would reasonably be down if an ice storm struck the
asset by clicking in the text box and entering the value.
The severity, in MGD, of the outage for the asset is entered in the next text box.
Next, add the owner's financial loss that would reasonably occur due to an ice storm striking
the asset, in dollars, can be entered.
Next, enter the number of regional fatalities that would reasonably occur for each category if an ice storm struck the asset by
clicking in the text box and entering the value.
Enter the number of regional serious injuries that would reasonably occur for each category if an ice storm struck the
asset by clicking in the text box and entering the value.
Enter the lost gross regional product that would reasonably occur for each category if an ice storm struck the
asset by clicking in the text box and entering the value.
Enter any other consequences that would reasonably occur for each category if an ice storm struck the
asset by clicking in the text box and entering the value, that are not included in the other categories.
Add the Vulnerability. The vulnerability is a value between 0 and 1 indicating the ability of the asset to resist
the ice storm.
Add the Threat Likelihood. The threat likelihood is the probability the ice storm will occur in a given year between 0 and 1.
When you are finished calculating the risk to ice storms, click Calculate Manually and Update. To discard your work, click
Cancel.
When you are finished calculating the risk to ice storms, click Update. To discard your work, click
Cancel.
Dependency and proximity threat analysis is performed differently than natural or malevolent threat
analysis. The dependency threats that can be analyzed are loss of utilities, loss of
suppliers, loss of employees, loss of customers, and loss of transportation. The proximity of your
assets to other potential targets is the only proximity hazard that could be considered.
To edit a threat asset pair, click the edit button next
to the desired pair and the below screen will appear.
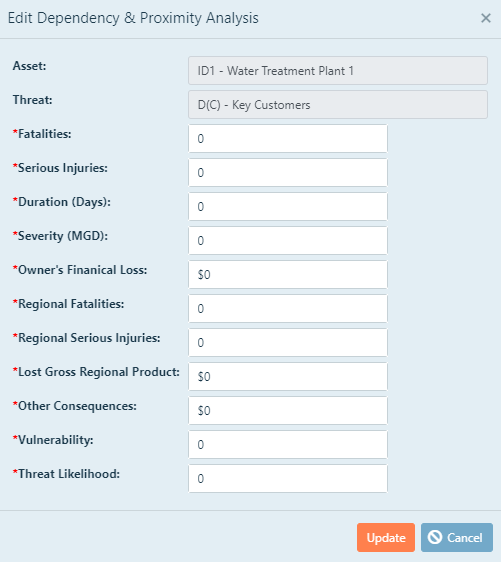
NOTE: If you elected to not include a statistical value of life and
a statistical value of serious injury
on the start-up page, this section will still appear on the page but will not be calculated into the
final risk number. The statistical value of life is needed to calculate the potential impact of
fatalities on your system on a monetary level.
The number of fatalities that are expressed here is the number that occurs within a short period of
time after the attack and should not include fatalities that occur weeks later. This also includes
fatalities both on-site and off-site.
NOTE: If you elected to not include a statistical value of life and
a statistical value of serious injury on the start-up
page, this section will still appear on the page but will not be calculated
into the final risk number. The statistical value of serious injury is needed to calculate the
potential impact of serious injuries on your system on a monetary level.
The number of serious injuries that are expressed here is the number that occurs within a short period
of time after the attack and should not include serious injuries that are long term. Serious injuries
that are to be included are any injury that would result in the loss of work time or disability. This
includes serious injuries both on-site and off-site.
The Duration and severity of the consequences give values to the length of time that the asset will be out of
service and the amount of water that will not be delivered per day. The duration is defined as the number of days that
the asset is out of service while waiting for repair or replacement.
The Severity is the number of million gallons per day (MGD) that will not be delivered to customers, given
that the asset is not functioning. These values are utilized in the service interuption costs in the financial total
as well as the resilience calculations shown on the Risk/Resilience Analysis page of PARRE™.
The Owner's Financial Loss of an attack is the monetary amount that would need to be spent in order to
repair the damaged assets that were affected by the attack. This value is
expressed in dollars.
The Lost Gross Regional Product of an attack is the monetary amount that the served community would suffer due to
an inability to do business as a result of an inability to deliver water because the asset is non-functional.
The number of regional fatalities is the estimated number of non-employees, off site,
who are fatally injured or sickened due the threat-asset event
and die immediately or within 30 days of the event.
The number of regional serious injuries is the estimated number of non-employees, off site,
who are seriously injured or sickened due the threat-asset event within 30 days.
Other consequences include any impacts that would occur that are not included in the other categories.
Vulnerability is defined by the J100 as an
estimate of the likelihood that each specific threat or
hazard, given that it occurs, will overcome the defenses of each critical asset to the level identified
in the consequences estimate for that threat-asset combination
.
Threat likelihood is defined by the J100 as an estimate of the probability that a particular attack will
occur within a given time frame (usually one year).
This page contains the URI questions to determine the utility's system resilience. The URI questions are broken down
into two sections: Financial and Operational. The total URI score is displayed at the top of the page. To answer each
of the questions, click on the edit button on the desired line. An example of the pop-up that appears is:
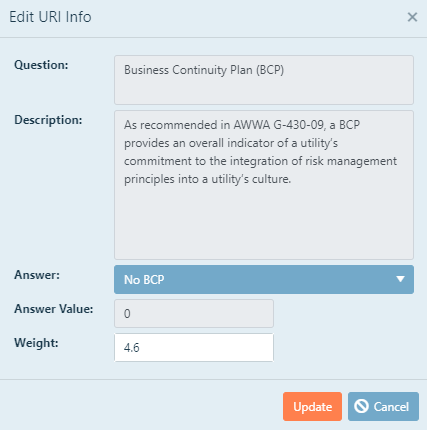
Utilizing the pull-down choices, choose the answer that best applies to your facility. The option value and weight will
automatically populate. The existing values and weights are populated based on the J100 Standard weights. If you would
like to change the weights, you may change them by clicking in the appropriate text box, and entering the desired
weight. NOTE: If you choose to change the weights, you must change the weights of the other questions as well to
achieve a total sum for all questions of 100.
This page contains the summary of your analysis. This table combines all
results into one table. This table is able to be sorted by any category, but can also be exported into excel.
The risk and resilience management page allows you to complete a benefit-cost
analysis for proposed countermeasures. New options for countermeasures, or groups of countermeasures, are added here. The display
shows the risk values for the baseline.
Once you have completed your baseline, you can create options. Options consist of one or more
proposed countermeasures that you would like to evaluate. To add an option, click Add/Edit Option(s) in the top left hand of the page,
and then select or create an option.
After clicking New, you will be asked to name your option. Use a name that you will be able to recognize. You are also given the
option to add a description of the option.
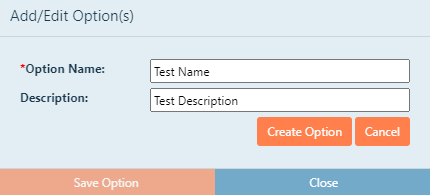
To name the option, click in the text box, and then type the name.
To add a description, click in the second text box, and then type a description. When finished, click Create Option.
NOTE: Once you add an option, you will create a copy of the baseline assessment. If you make any changes to the baseline assessment
after the creation of an option, you must also manually make those changes in the options.
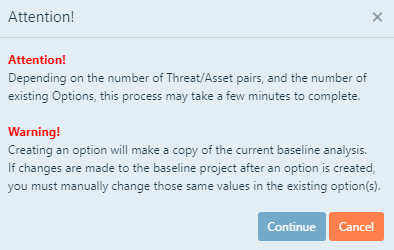
After clicking continue, you will be able to add the countermeasures associated with each option. Click New Countermeasure.
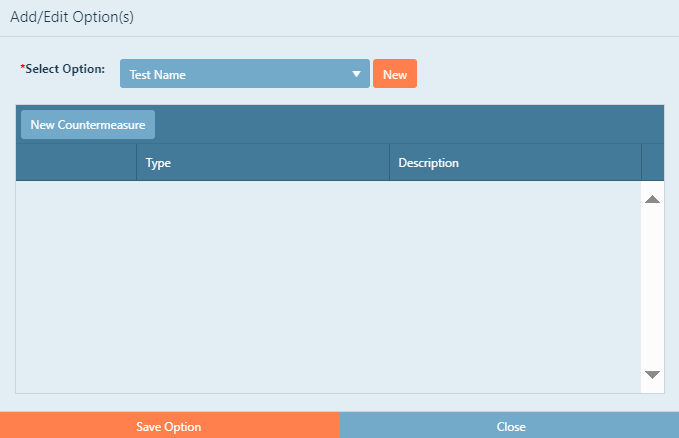
After clicking New Countermeasure, either select a countermasure you have already created from the drop down menu, or
click New.
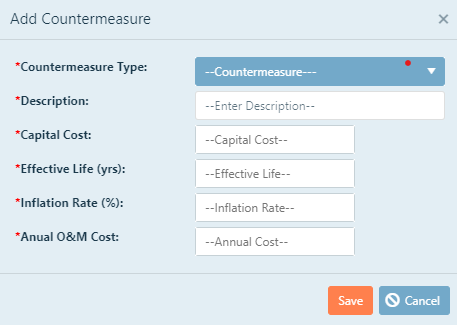
Select the type of countermeasure. Click in the first text box, and then select the applicable option.
Add a detailed description, click in the second text box, and then type the desired description.
If there is an initial capital cost, type the cost in the text box.
Enter the effective life of the countermeasure by typing the value, in years, in the text box.
Type a desired inflation rate, in percent, over the life of the countermeasure in the last text box.
If there are annual O&M costs, type the annual cost in the final text box. When finished, click Save.
To edit your analysis with your proposed countermeasures, return to the Projects tab. For the project that you have created the
countermeasures for, click the arrow button on the far left. This will drop down the proposed options you have created. It also shows you the
Annual Cost, Gross Benefits, Net Benefits, and B/C Ratio. On the option you want to edit, click Open Option.
At this point you will adjust any consequence, vulnerability, or threat likelihood values that would be affected by the proposed countermeasures.
To view the results of your changes, simply return to the Risk and Resilience Management page of PARRE™ and it will show the calculated risk values
for the original assessment, the risk values any proposed options you have created, and the change in risk values from the options.
At the bottom of the page, the Annual Gross Benefits, Annual cost, Net Benefits, and B/C Ratio are shown.
NOTE: Calculations for B/C Ratio in the Web version of PARRE use a different algorithm than that of the desktop version of PARRE, therefore,
B/C Ratio values may not match after importing a desktop project into the Web version of PARRE.
To edit a countermeasure you already added, on the R&R Management tab, click Add/Edit Option(s). Select the option,
and click the edit button.
To remove a countermeasure you already added, on the R&R Management tab, click Add/Edit Option(s). Select the option,
and click the delete button.
The benefit-cost (B/C) ratio and net benefit are calculated for you based on the changes you made to the option
analysis with the proposed countermeasures in place. In the risk and resilience management page, the option
information is displayed in two columns next to the baseline information. To the right of the baseline value is
the option risk value. The next column contains the difference between those two risk values. If there is a beneficial
change in the risk, then the box will be green and the positive delta will display. If there is no change, the
box will remain blue and the value inside will be zero (0). If there is a negative change between the baseline and
the option, the box will be red and the negative value will display.
Additional columns will appear to the right of the exiting ones as you add more options to the analysis.
The total gross benefits of each option, along with the present value cost, net benefit, and B/C ratio are displayed
at the bottom of the page. The total gross benefits are calculated as the sum of the "change" column for that
option.
Annual gross benefits refers to the total dollar amount of improvements that the option provides for the system.
Annual Cost is the one-year cost of the investment as calculated by the Equivalent Actual Cost (EAC)
equation. This allows the user to compare annual reductions in risk to annual costs of improvements.
Net benefits is the difference between the annual gross benefits, and annual cost.
The B/C ratio helps determine if the option is beneficial to the system, or if its cost is more than the benefits.
If this value is greater than 0, it has greater benefits than costs, but if this number is less than 0, the costs
are greater than the benefits.
Definitions provided in this section are intended to clarify this document and to provide support in the
use of PARRE™. Most terms may also be found in the J100 standard.
Asset: An item of value or importance that if targeted, exploited,
destroyed, or incapacitated could result in injury, death, economic damage to the owner of the asset or
to the community it serves, destruction of property, or could profoundly damage a nation's prestige and
confidence. Assets may include physical elements (tangible property), cyber elements (information and
communication systems), and human or living elements (critical knowledge and functions of people).
Human: An employee or other critical person to the operation and management
of a system.
External: An asset that is not a direct asset of the studied system and
may include utilities and suppliers.
Physical: Any asset that is physically owned, operated, and maintained
by the facility being analyzed.
Conditional Threat Analysis: Assumes that the
likelihood of a malevolent threat attacking an asset is 100 percent. This type of analysis puts more
weight on the consequences of the attack and vulnerability of an asset.
Consequence: The immediate, short- and long-term effects of a
malevolent attack or natural incident. These effects include losses suffered by the owner of the asset
and by the community served by that asset. They include human and property loses, environmental damages,
and lifeline interruptions. Property damage and losses from interruption of operations are expressed in
monetary units.
Consequence Mitigation: A series of planned and coordinated
actions or system features designed to: reduce or minimize the damage caused by attacks (consequences of
attack); support and compliment emergency forces (first responders); facilitate field-investigation and
crisis management; and facilitate rapid recovery and reconstitution. May also include steps taken to
reduce short- and long-term consequences, such as providing alternative sources of supply for critical
goods and services. Mitigation actions and strategies are intended to reduce the consequences of an
incident, whereas countermeasures are intended to reduce the consequences of an incident, whereas
countermeasures are intended to reduce the probability that an attack will occur or will cause a failure
or significant damage if it occurs.
Countermeasure: An action, device, or physical element that
reduces risk by affecting an asset, threat, or vulnerability. Countermeasures may be directed at
providing detection, deterrence, devaluation, delay, or response. Often used in conjunction with other
security actions to create a more comprehensive and holistic security system and may incorporate
consequence mitigation.
-
Detect: Use of security countermeasures to discover an adversary's
intention to attack an asset or exploit the asset's vulnerability. Detection does not by itself seek
to prevent an attack, but rather recognize and to trigger other types of security actions.
-
Deter: Actions to cause potential adversaries to perceive that the
risk of failure is greater than that which they find acceptable, e.g., restricted access, vehicle
checkpoints, enhanced police presence.
-
Devalue: Actions to reduce the adversary's incentive by reducing the
target's value, e.g., developing redundancies, maintaining back-up systems or cross-training key
personnel.
-
Delay: Use of security countermeasures to slow the actions of an
adversary to the point that a successful attack takes long enough to be interdicted or longer than
expected or desired by the adversary.
-
Respond: Reactive use of emergency response capabilities to deal
with the immediate consequences of an incident or attack.
Critical Asset: An asset whose absence or unavailability would
significantly degrade the ability of a utility to carry out its mission or would have unacceptable
financial, political, or environmental consequences for the owner or community.
Dependency: The reliance of an asset, system, network, or collection
thereof, within or across sectors, on input, interaction, or other requirement from other sources in
order to perform mission objectives.
Dependency Hazard: A dependency the denial of which has the
potential to disrupt the function of the asset, system, etc.
Direct Expert Judgement: Members of the evaluation
team who are familiar with a facility's layout and work flows and are knowledgeable about the asset
discuss the likelihood of success and their reasoning for their estimates.
Event Tree Analysis: An inductive analysis process that
utilizes a graphical "tree" constructed to analyze the logical sequence of the occurrence of events in,
or states of, a system following an initiating event.
Failure Mode: A way that failure can occur, described by the means
or underlying physics by which element or component failures must occur to cause loss of the subsystem
or system function.
Fault Tree Analysis: A deductive, binary logic diagram that
depicts how a particular undesired event can occur as a logical combination of other undesired events.
Frequency: The rate of occurrence that is measured by the number of
events per unit time, in this context, usually one year unless otherwise specified, or in a particular
number of iterations, e.g., one defect per million products.
Function: The action or activity that an asset or facility performs
which is critical to operation or providing services to customers.
Hazard: Something that is potentially dangerous or harmful, often the
root cause of an unwanted outcome.
Incident: An occurrence or event (natural or human caused) that requires
an emergency response to protect life or property. Incidents can, for example, include major disasters,
emergencies, terrorist attacks, terrorist threats, wildfires, floods, hazardous materials spills, nuclear
accidents, aircraft accidents, earthquakes, hurricanes, tornadoes, tropical storms, war-related disasters,
public health and medical emergencies, power outages, and other occurrences requiring an emergency response.
Initiating Event: An event that appears at the beginning of a
chain of events, such as in an event tree or failure tree. In this context, generally includes malevolent
attacks, accidents, natural hazards, failure of key dependencies, or disruption of a hazardous neighboring site.
Natural Hazard: Incidents which are not human-caused including
earthquakes, floods, hurricanes, tornadoes, and wildfires.
Owner Indicator: An estimate of the financial losses to the owner
of the asset or system for each threat-asset pair. This includes repair and replacement of any damaged or
destroyed assets, business interruption costs, penalties for service interruption or environmental impacts,
and any other costs directly related to the attack.
Path Analysis: The analysis of the physical paths that adversaries
can follow to accomplish their objective.
Preparedness: A continuous cycle of planning, organizing, training,
equipping, exercising, evaluating, and taking corrective action in an effort to ensure effective coordination
during the incident response and recovery, including continuity of operations plans, continuity of government
plans, and preparation of resources for rapid restoration of function.
Prioritization Level: The level of importance chosen by the
analysis team for either an individual asset or a threat-asset pair, which is scored on a 1-5 scale.
Probability: A measure of the likelihood, degree of belief, frequency,
or chance that a particular event will occur in a period of time (usually one year) or number of iteration
or trials. This is usually expressed quantitatively as a value between 0 and 1, a range of values between
0 and 1, a distribution (density function), or the mean of such a distribution. Probability can also be
expressed in qualitative terms, e.g. low, moderate, or high, if there is a common understanding of the
meaning of the qualitative terms.
Proximity Hazard: A threat that arises from being near another facility
that is or could be hazardous.
Proxy Indicator: Estimates the likelihood of malevolent attacks
based on the adversary's objectives and capabilities and the attractiveness of the facility relative to
alternative targets.
Reference Threat: A particular attack specified in terms of
intensity or magnitude, mode, and medium of delivery, to be used in a consistent fashion across numerous
assets to facilitate direct comparisons. It is not to be confused with "design basis threat", which is
the type and intensity of threat a facility is designed to withstand.
Regional Indicator: An estimate of the financial losses to the
community, suppliers, and customers. This is dependent on the length of time and the extent of which the
service is disrupted. Customers may include other utilities and the destruction of an asset may cause
other utilities to become unavailable to customers.
Resilience: The ability of an asset or system to withstand an attack or
natural hazard without interruption of performing the asset or system's function or, if the function is
interrupted, to restore the function rapidly.
Risk: A function of consequences, hazard frequency or likelihood, and
vulnerability, which with point estimates, is the product of the terms. It is the expected value of the
consequences of an initiating event weighted by the likelihood of the event's occurrence and the
likelihood that the event will result in the consequences, given that it occurs. Risk is based on
identified events or event scenarios.
Risk Analysis: The technical and scientific process of estimating
the components of risk and combining them into the estimate of risk. Risk analysis provides the processes
for identifying threats, hazards or hazard scenarios, event probability estimation, vulnerability
assessment, and consequence estimation.
Risk Management: The deliberate, cyclical process of understanding
risk based on a risk analysis and deciding upon, implementing and managing action, e.g., security
countermeasures or consequence mitigation features, to achieve an acceptable level of risk at an acceptable
cost. Risk management is characterized by identifying, measuring, estimating, and controlling risks to a
level commensurate with an assigned or accepted value, monitoring and evaluating the effectiveness of
implementation and operation of the selected options (with corrective action as needed) and periodic
repetition of the full risk management cycle.
Scenario: A combination of events and system states that lead to an
undesired event. A scenario defines a suite of circumstances of interest in a risk assessment. In the
present context, a scenario includes at least a specific threat (man-made or natural hazard) to a specific
asset, with the associated probabilities and consequences.
Statistical Value of Life: The monetary value placed on
eliminating the risk of one premature death.
Statistical Value of Minor Injury: The monetary
value placed on eliminating the risk of an individual being injured to an extent that the injuries do not
affect the person's ability to continue a normal life.
Statistical Value of Serious Injury: The
monetary value placed on eliminating the risk of an individual being injured to an extent that they are
unable to continue living a normal life.
System: A group of interacting, interrelated, or interdependent elements,
such as people, property, materials, environment, and/or processes, for a single purpose or defined set of
purposes. The elements together form a complex whole that can be a physical structure, process, or
procedure of some attributes of interest.
Threat: A man-made or natural event with the potential to cause harm.
In malevolent risk analysis, threat is based on the analysis of the intention and capability of an
adversary (whether insider or outsider) to undertake actions that would be detrimental to an asset.
Threats may also arise from natural hazards or dependency hazards (interruptions of supply chains or
proximity to dangerous or hazardous sites.
Threat-Asset Pair: The combination of a single threat and a
single asset within the system for the purpose of analyzing the risk and resilience for each pair.
Threat Likelihood: The probability that an undesirable event
will occur. With natural hazards, the threat likelihood is the historical frequency of similar events
unless there is a belief that the future will differ from the past. With malevolent threats, the
likelihood is a function of available intelligence, the objectives and capabilities of the adversary,
and the attractiveness, symbolic, or fear-inducing value of the asset as a target.
Utility Resilience Index: An assessment of a utility's
ability to absorb and/or cope with an incident and return to normal operations as quickly as possible.
The URI is comprised of an Operational Resilience Index and a Financial Resilience Index.
Vulnerability: An inherent state of a system (e.g., physical,
technical, organizational, cultural) that can be exploited by an adversary or impacted by a natural
hazard to cause harm or damage. Such weaknesses can occur in building characteristics, equipment
properties, personnel behavior, locations of people, equipment, and buildings, or operational and
personnel practices. Vulnerability is expressed as the likelihood of an event's having the estimated
consequences, given that the event occurs.
Vulnerability Assessment/ Vulnerability Analysis: A
systematic examination of the ability of an asset to withstand a specific threat or undesired event,
including current security and emergency preparedness procedures and controls. A vulnerability assessment
often suggests countermeasures, mitigation measures, and other security improvements.
Vulnerability Estimate: The probability, given the incident
occurs, that an attack or natural event will cause specifically estimated consequences.
Worst Reasonable Case: An operating assumption for
estimating consequence values that utilizes the most severe but reasonable and credible consequences for
a specific hazard but does not combine unlikely coincidences. In an adversarial event, it directly
reflects the assumption that an adversary is knowledgeable about the asset do be attacked and adaptive
given emergent conditions.